

Tanking Tech Sets Portfolio Back 1.5%
The S&P 500 slipped more than 2% last week because tech stocks fell hard on Friday. The top‑five sector list stayed almost the same, but the lower half shuffled a lot.
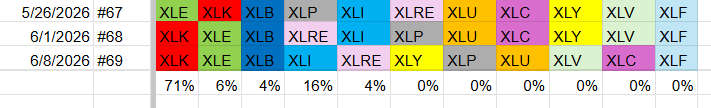
Among the leaders, Industrials moved up to fourth place and Real Estate slid to fifth. The three leaders – Technology, Energy and Materials – stayed unchanged, with Technology still on top.
In the bottom half, the biggest moves were:
- Consumer Discretionary rose from ninth to sixth.
- Consumer Staples fell from sixth to seventh.
- Utilities slipped from seventh to eighth.
- Health Care moved up from tenth to ninth.
- Communication Services dropped from eighth to tenth.
- Financials stayed at the bottom.
Weekly Relative Rotation Graph
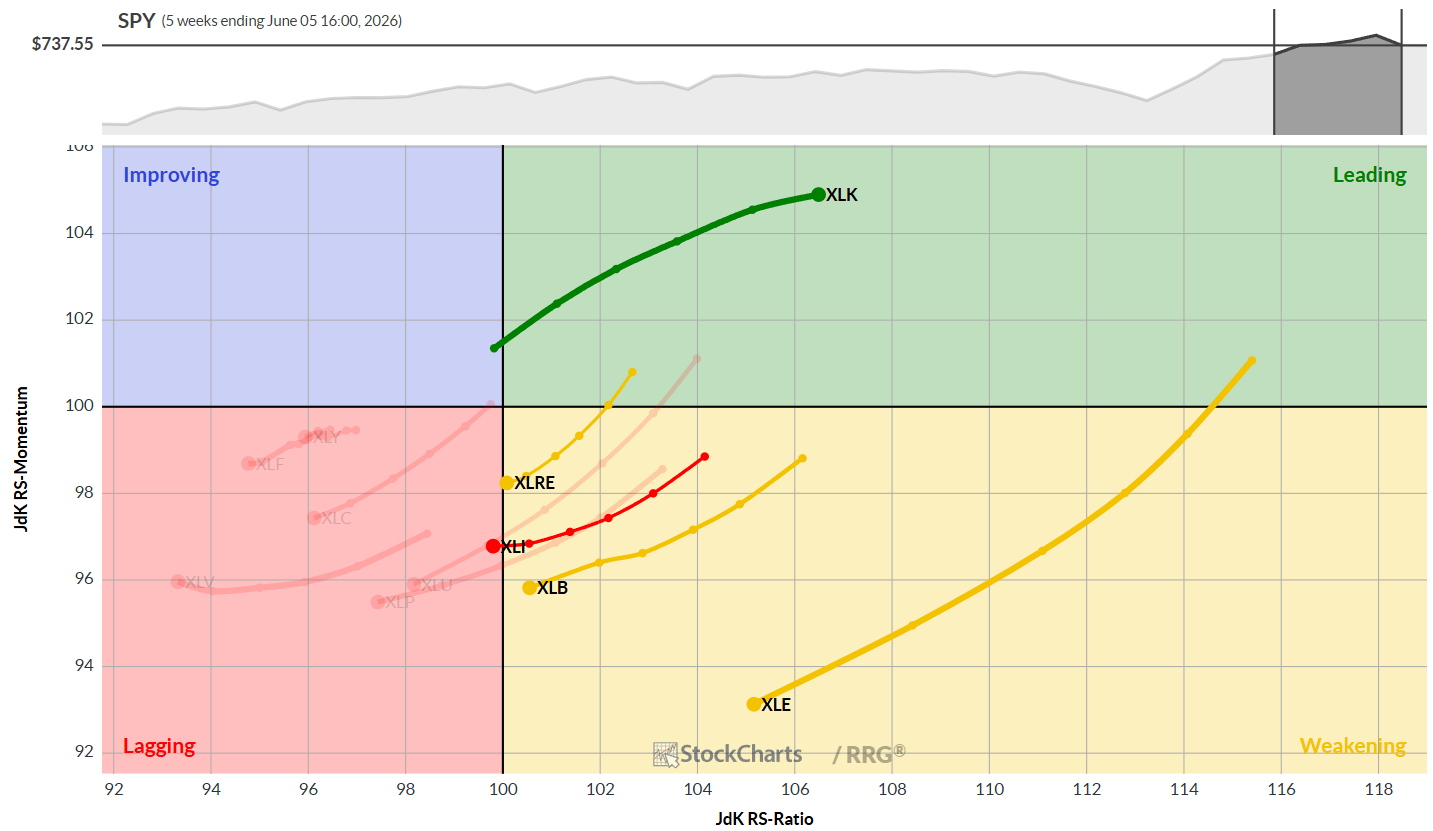
At the end of last Friday, the weekly RRG showed Technology as the only sector in the leading quadrant, still pointing upward despite the recent drop. The other four top sectors were heading down.
Industrials entered the lagging quadrant, while Real Estate and Materials are close behind. Energy sits on the right side of the graph, suggesting more weakness may follow.
Daily Relative Rotation Graph
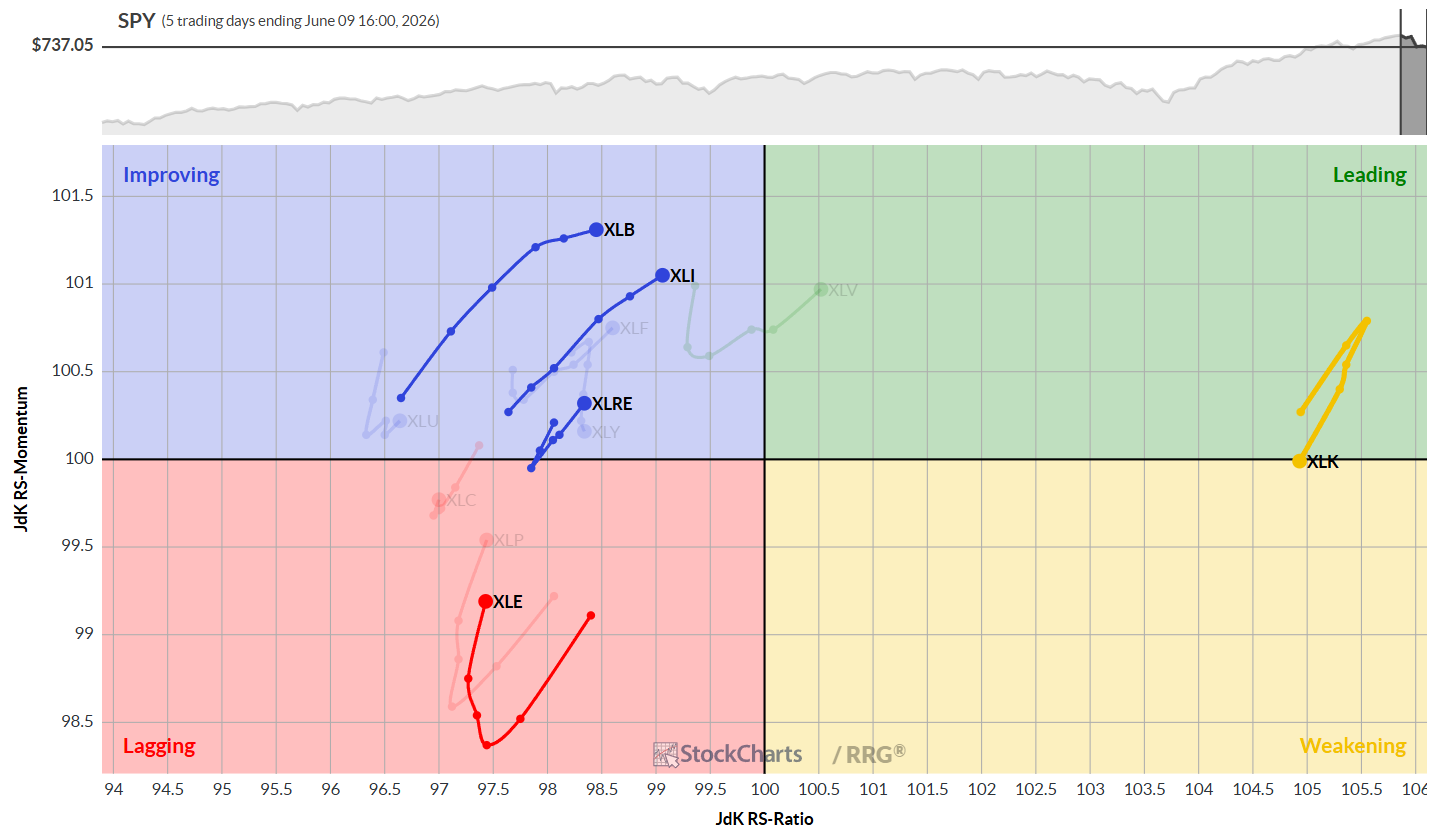
The daily chart looks brighter. Technology keeps a high RS Ratio, hinting at a possible move into the leading quadrant soon. Materials, Industrials and Real Estate are already heading upward and sit in the leading quadrant. Energy, still lagging, is curving upward toward the improving area.
Sector Highlights
Technology
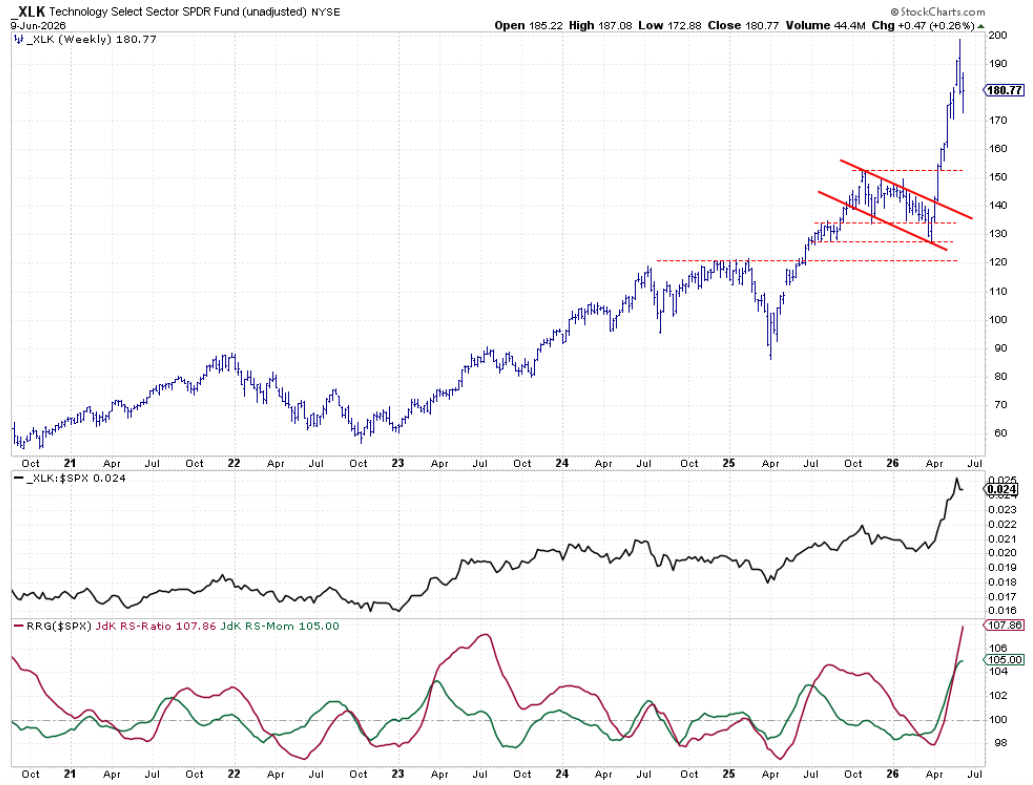
Tech stays strong even after a sharp pullback. The price chart, the raw relative‑strength line, and the RRG lines all stay healthy. The sector has room to correct without breaking its overall uptrend.
Energy
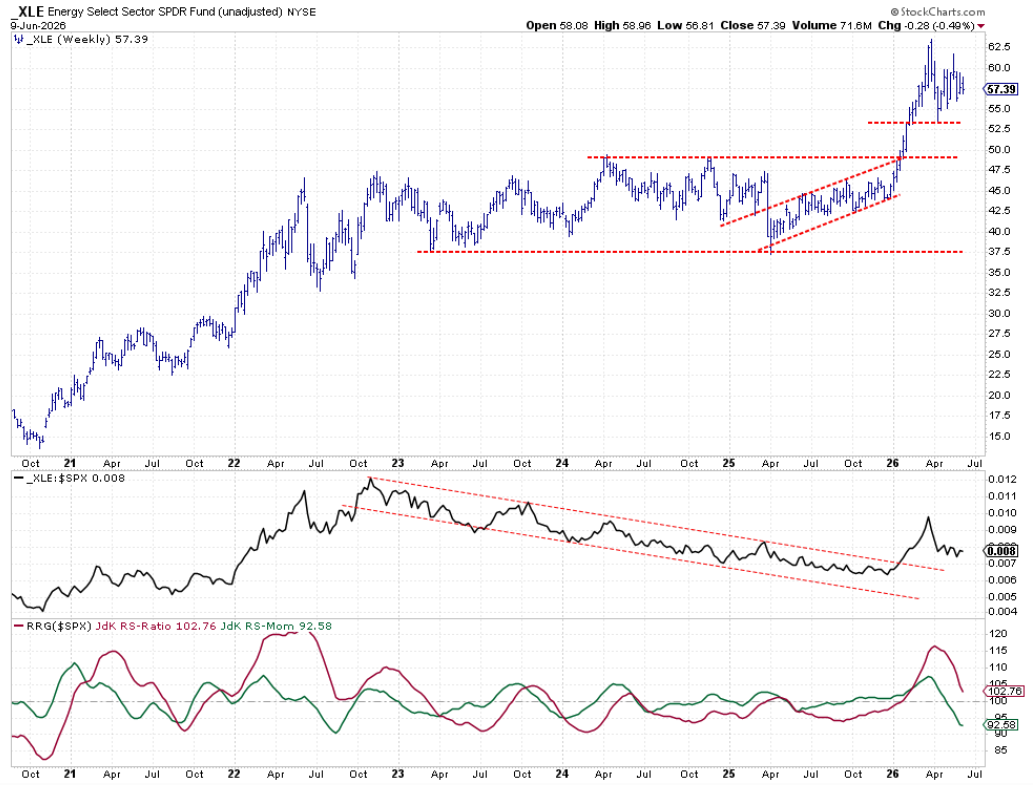
Energy is trading flat, likely forming a triangle. The price is still in an uptrend, but the raw RS line has paused. RRG lines keep falling, so the sector needs stronger relative strength to turn the curve upward.
Materials
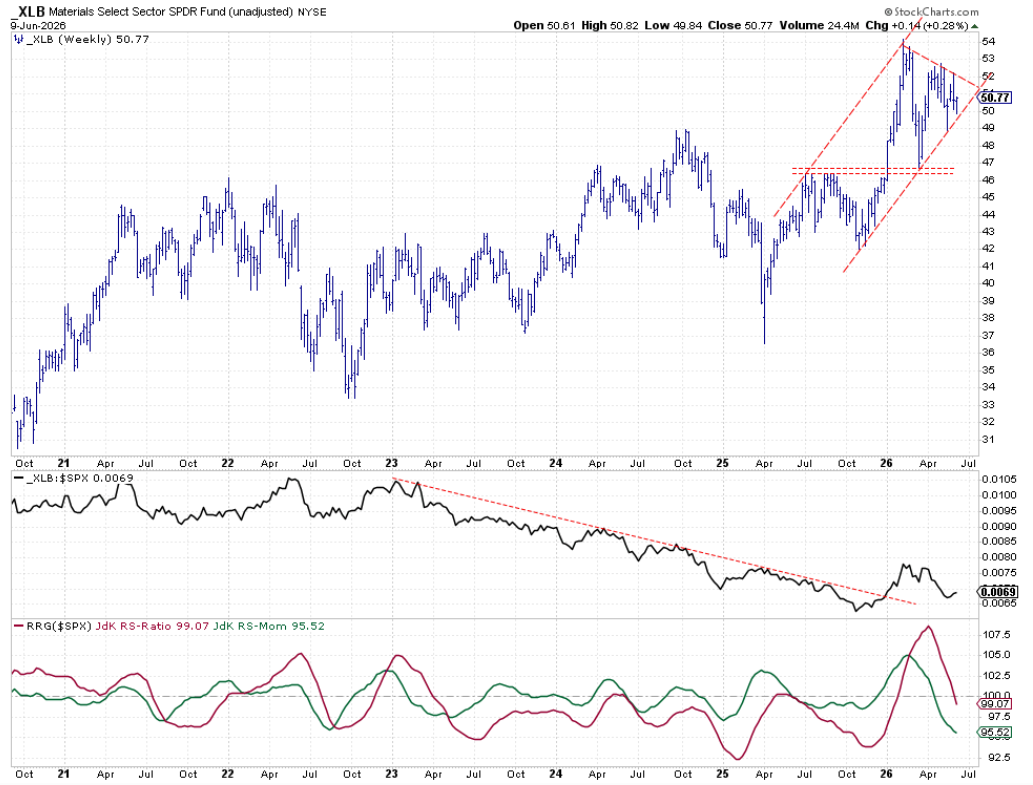
Materials shows a pattern similar to Energy – an uptrend with sideways moves, forming a triangle. The raw RS line is looking for new support after a double top. RRG lines are falling, but the decline is slowing, and daily RRG shows some improvement.
Real Estate
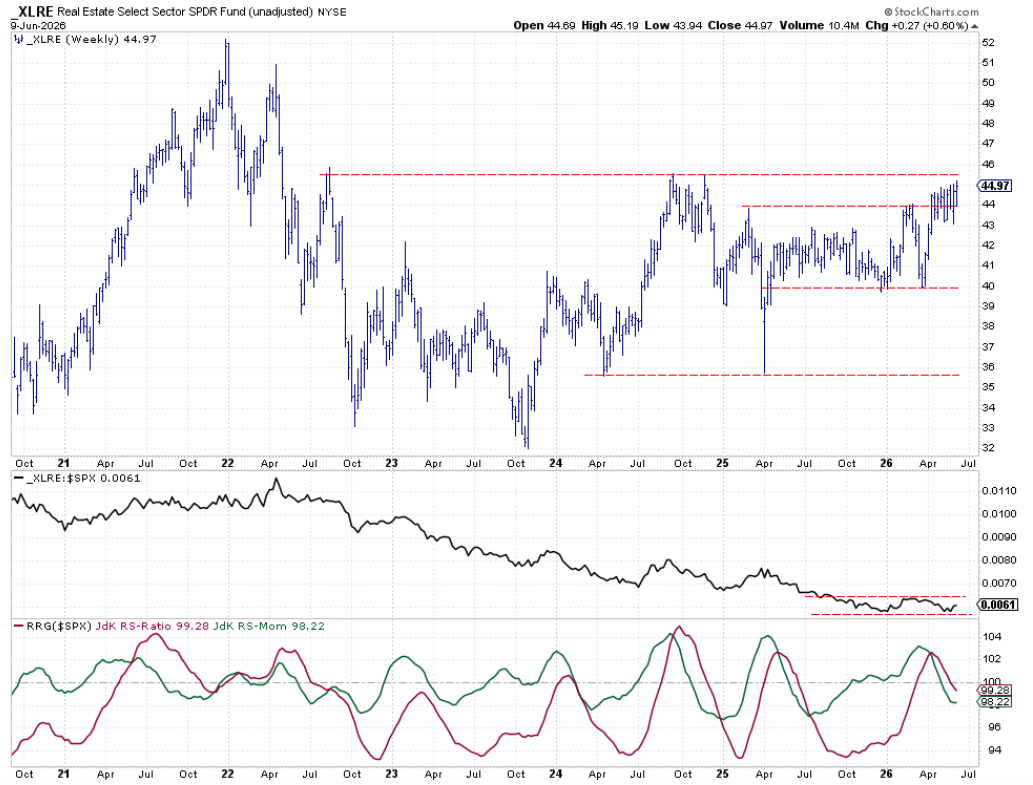
Real Estate’s price is edging higher, close to a resistance level just above 45. Breaking that line could spark more gains. The relative‑strength line is flat, finding support at the year‑start level, hinting at a possible bottom. RRG lines are still falling, but momentum has steadied, which could lift the RS‑ratio.
Portfolio Performance
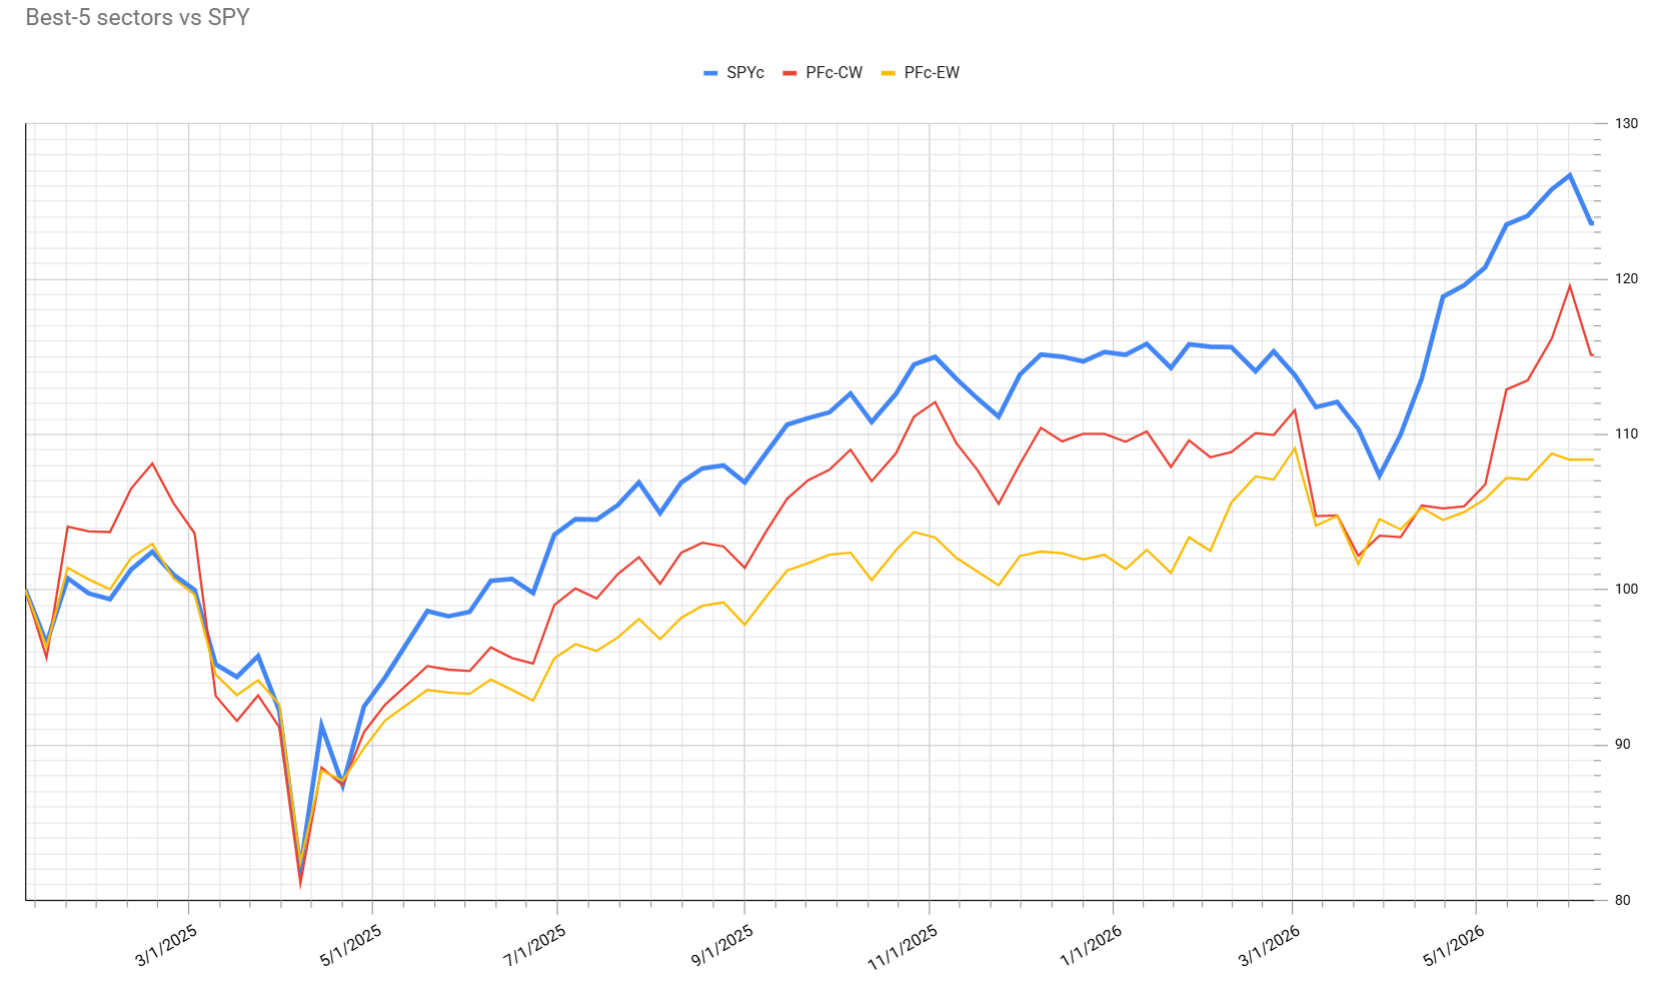
The portfolio fell a little last week, mainly because tech dropped 6% on Friday and the S&P 500 fell overall. The loss was about 0.7%, a small increase from the previous -0.14% loss two weeks ago. The strategy still follows the top‑five sectors ranked by the Relative Rotation Graph, using both weekly and daily data.
Conclusion
Technology stays the strongest sector, but Energy, Materials, and Real Estate show early signs of recovery on the daily RRG. Watching these moves will be key for future portfolio results.
Source: Materials provided by https://articles.stockcharts.com.Note: Content may be edited for style and length.