

Chart 1: S&P 500 Equal‑Weighted Index ($SPXEW)
For a while, the market’s big gains came from a few giant tech companies. Most other stocks were left behind. Lately, AI stocks took the lead while other sectors fell.
Now things are changing. Three different tools that measure how many stocks are joining the rally all show a wider participation.
The easiest way to see this is to give every stock the same size. When the S&P 500 Equal‑Weighted Index ($SPXEW) climbs higher than the regular cap‑weighted S&P 500, it means the smaller 493 stocks are doing better together. The equal‑weighted index has just hit a new high, showing that a broad catch‑up is in progress.
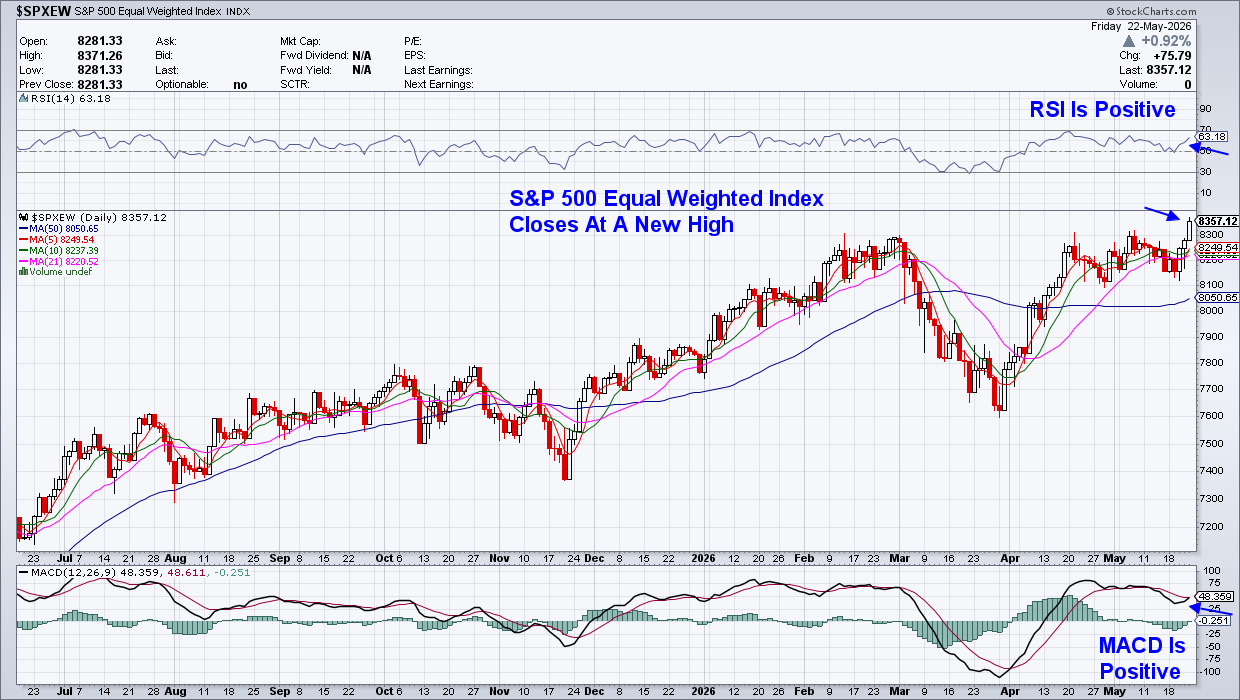
Chart 2: Percent of S&P 500 Stocks Above 20‑Day Moving Average
More S&P 500 stocks are now trading above their 20‑day moving average. The rise came from many sectors, not just a handful of names.
This short‑term measure shows how many stocks are gaining momentum. When the number goes above 60 %, it tells us that a lot of stocks, not only the big ones, are moving up quickly. The fast rise proves this is a strong thrust, not a slow drift.
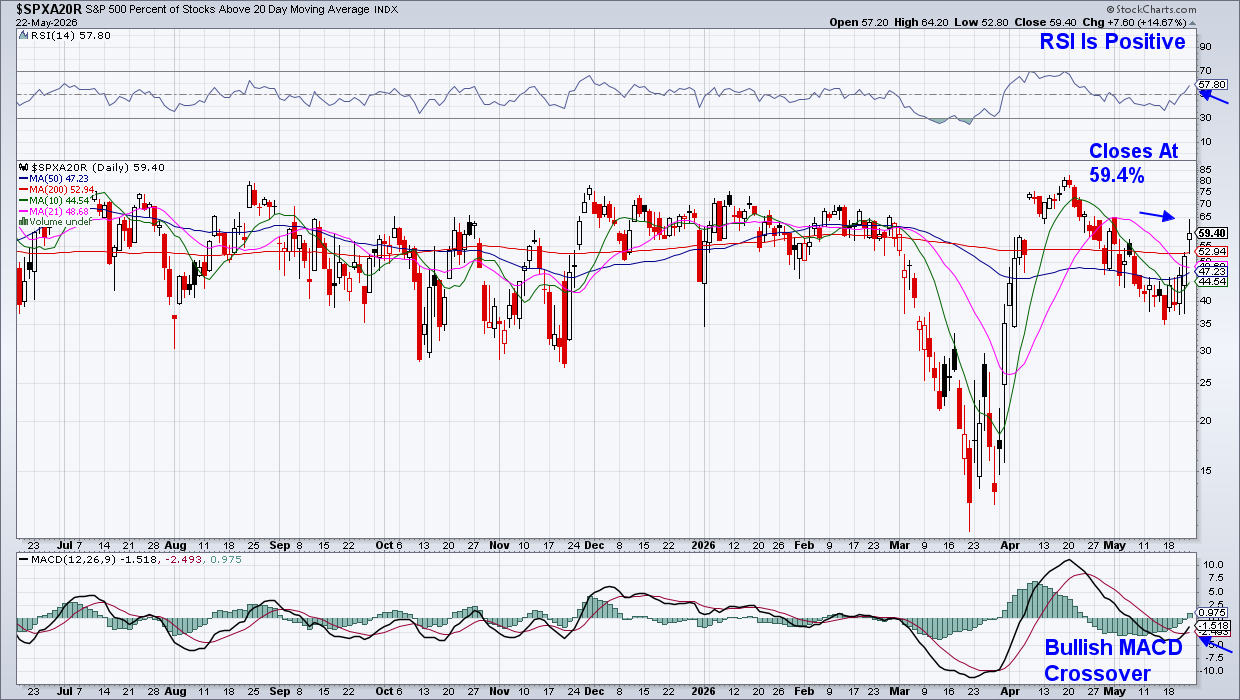
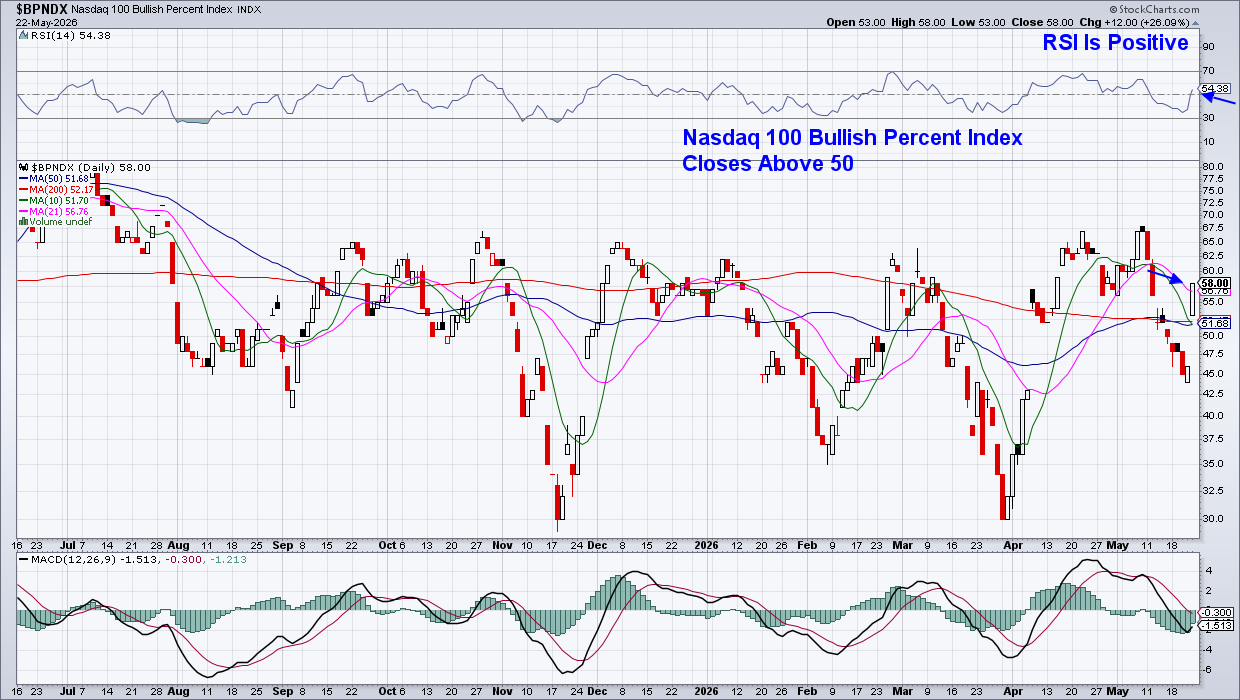
Chart 3: Nasdaq 100 Bullish Percent Index
The Bullish Percent Index (BPI) tells what share of stocks have a buy signal on a Point‑and‑Figure chart. It removes noise and looks only at supply‑and‑demand.
When the Nasdaq 100 BPI moves back above 50 %, most of the 100 biggest stocks are on active buy signals. This is not a guess about the future; it’s a snapshot of the current demand for these stocks. Seeing this rise together with the equal‑weight index and the 20‑DMA breadth makes the trend hard to ignore.
Source: Materials provided by https://articles.stockcharts.com.Note: Content may be edited for style and length.