
Friday marks a good moment to pause, look at your stocks, and see how the market feels.
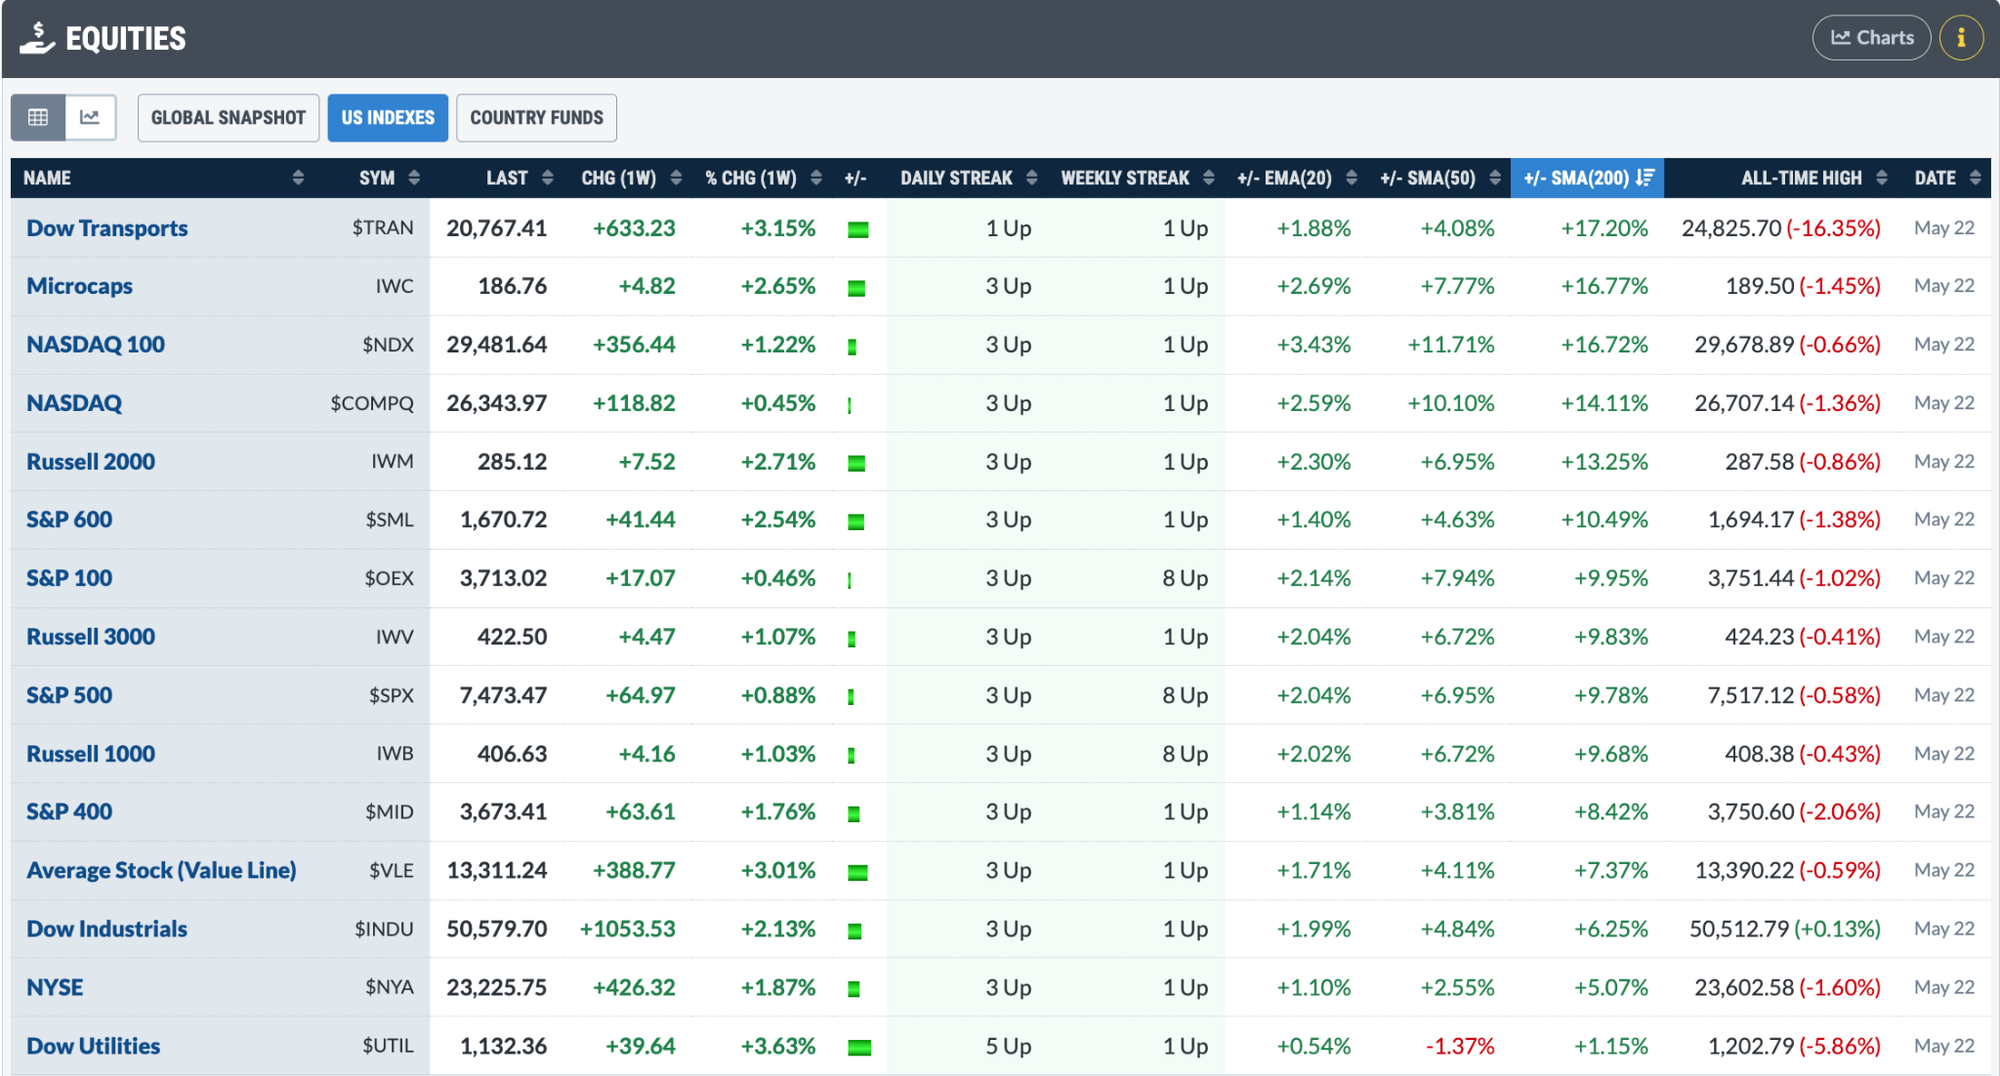
Even though this week seemed quiet—NVIDIA’s earnings didn’t wow anyone, consumer confidence was low, and there’s still no peace deal with Iran—big indexes ended strong. The Dow Jones closed at a new record.
The S&P 500 Equal‑Weighted Index hit a fresh high, and both the S&P Small‑Cap and Mid‑Cap indexes rose for three days in a row.
You can see all of this on the Equities panel of the Market Summary page. The Weekly Streak column shows each index enjoying a healthy week, with some continuing an eight‑week winning run.
Scrolling down to the Breadth panel gives an even brighter picture. More stocks are trading above key moving averages, new highs outnumber new lows, and advancing issues beat decliners.
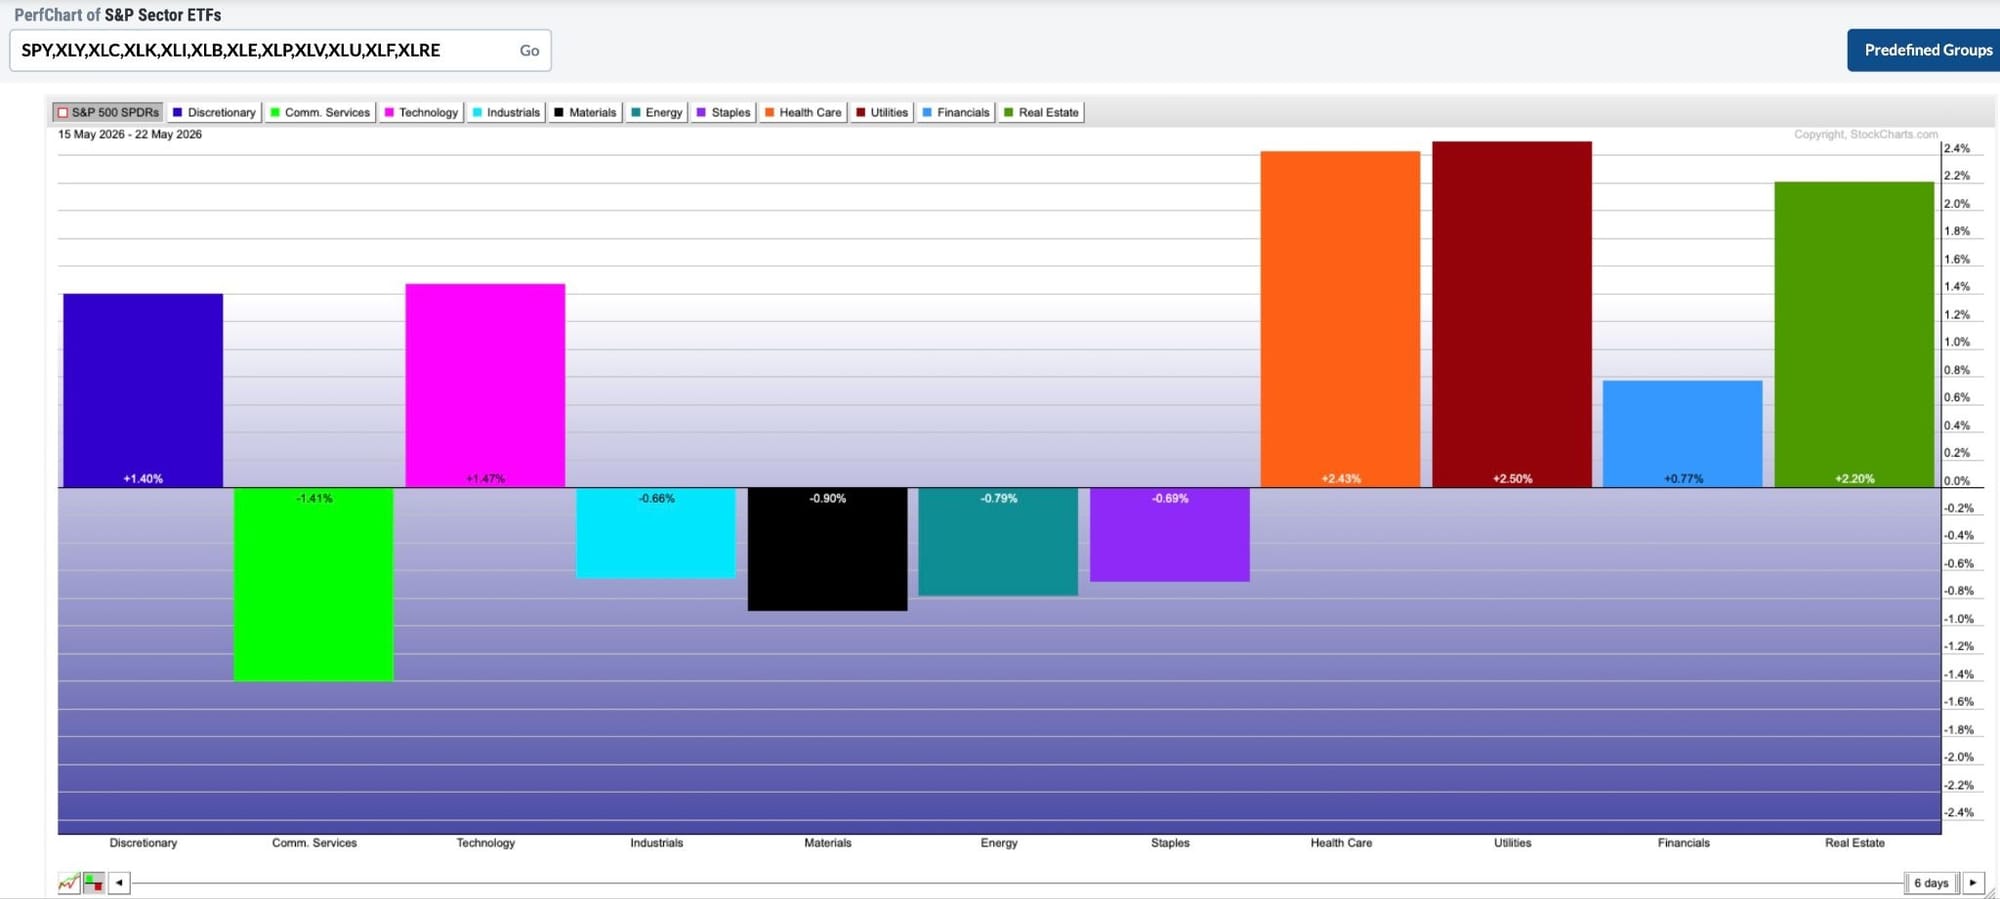
Pick “One Week” from the timeframe menu, then look at the Sectors panel. Utilities led with a 2.5 % rise, followed closely by Health Care at 2.43 %.
Are these moves likely to last? A Relative Rotation Graph (RRG) can help you decide. The chart shows which sectors are gaining strength, weakening, or staying steady.
In the Market Summary page, click the chart icon in the Sectors panel, then press the “Sectors RRG” button. Look at Utilities (XLU) and Health Care (XLV) to see where they sit on the graph.
RRG charts are great for spotting sector rotation and relative strength. Follow the weekly blog by Julius de Kempenaer for expert insights on how sectors shift.
Using the Market Summary page each week—or even each day—lets you see how indexes closed, which sectors led or lagged, whether market breadth is expanding, and how different asset groups compare. Over time you’ll notice patterns, trends, and changes in sentiment, preparing you for the next trading day.
Source: Materials provided by https://articles.stockcharts.com.Note: Content may be edited for style and length.