

Welcome to the Chart Fix!
Even when market breadth looks weaker, it can be a chance to buy, not a danger. This article looks at the SPY ETF, the S&P 500, and a special pattern in the RSP ETF.
SPY Shows a Strong Uptrend and Bullish Breadth
The SPDR S&P 500 ETF (SPY) has been moving higher for a long time. More than half of the stocks in the S&P 500 are trading above their 200‑day moving averages, which is a sign of strength.
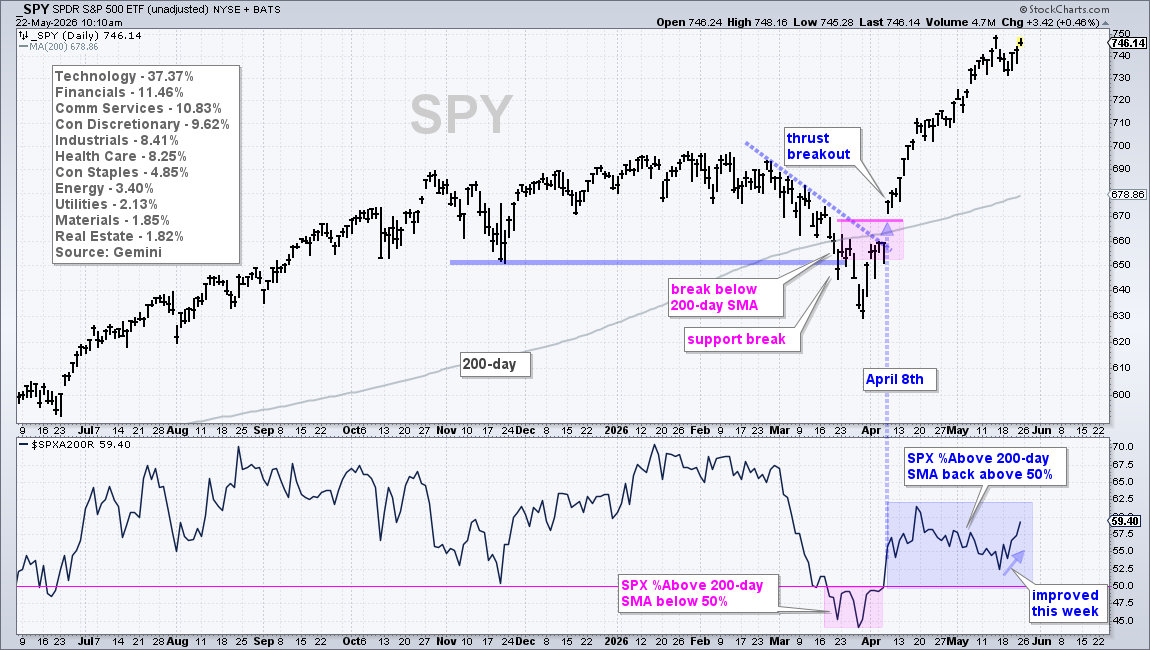
In early April, SPY fell below its 200‑day line, but it quickly bounced back and broke short‑term resistance on April 8. The breadth indicator (the % of stocks above the 200‑day line) also rose back above the 50% level, confirming the rally.
Although the breadth number dropped a bit from mid‑April to mid‑May, it stayed above 50%, keeping the market in a bullish mood. By the end of the week, the indicator climbed to almost 60%, showing that more stocks were regaining strength.
When Breadth Leads the Price, It Can Signal a Future Breakout
Traders often watch both price and breadth together. Sometimes the breadth indicator moves first, hinting that the price will follow.
The S&P 500 Equal‑Weight ETF (RSP) is forming a classic “cup‑with‑handle” pattern. This shape, first taught by William O'Neil, appears during an uptrend and usually points to a continuation higher.
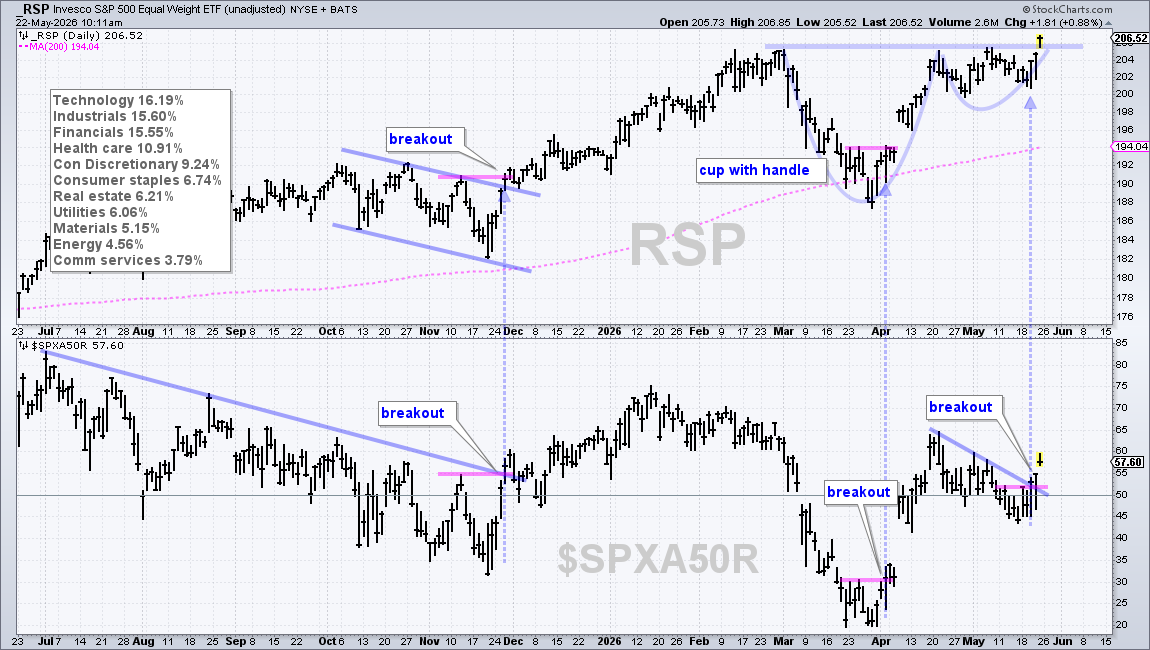
The short‑term breadth gauge for the S&P 500 (the % of stocks above the 50‑day SMA) fell from July to November, then jumped up in late November just before a price breakout. A similar pattern happened in March and early April.
Right now, the breadth measure fell from mid‑April to mid‑May while RSP formed the handle of the cup. This week the breadth rose again, breaking a short‑term barrier on Wednesday. That rise could be the first sign of a price breakout soon.
Takeaway
Even when breadth looks a little weaker, the overall picture for SPY and RSP remains bullish. Pull‑backs may be good buying moments. Watching both price and breadth together can give traders an early clue about upcoming moves.
Source: Materials provided by https://articles.stockcharts.com.Note: Content may be edited for style and length.