

Before we start…
Every morning most traders check the news – CNBC, Bloomberg, Fox Business, or any source they like. Markets move when new information appears, and we don’t want to be surprised by a story that could hurt or help our trades.
News can give us clues, but only if we know how to pull the useful parts out and turn them into a plan. Otherwise we end up reacting without a clear direction. Let’s change that.
How to Turn a Headline Into a Trade Idea
News tells a story. Your job is to change that story into a chart pattern that can become a trade. The chart will show if the market believes the story.
Use this easy workflow each day:
- Find the main driver
- Look at the stock’s fundamentals and technical summary
- Check the trend and RSI
- Mark key price levels and possible outcomes
- Compare the stock to the market, its sector, and a few rivals
The steps are simple and can be repeated. Feel free to add or remove parts to fit your own style.
Step 1 – What Is the Market Reacting To?
Is the news about growth, earnings, guidance, or something else? Pull out the single idea that the market cares about most.
Example: A headline reads, “Uber bets big on travel, hotels and AI voice bookings at its annual showcase.” The core driver is Uber’s push to grow beyond ride‑hailing into new areas. That’s the growth story.
Step 2 – Look at the Stock Summary
Open the stock’s summary page. Check the technical rank, earnings, revenue, and the next earnings date.
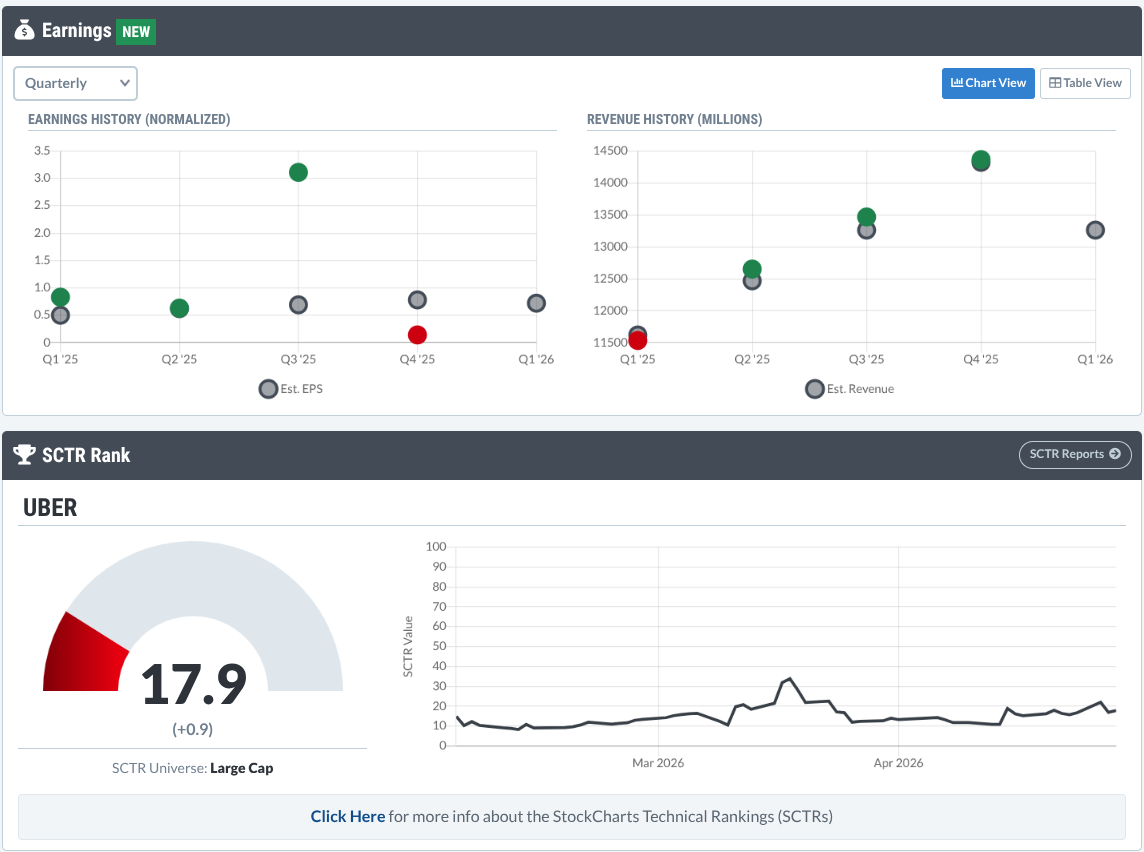
In this example, Uber’s earnings have been mixed, but revenue keeps rising. The technical rank looks weak, so there is no strong reason to be bullish yet.
Step 3 – Identify the Current Regime (Trend + RSI)
News can be bullish or bearish, and the price can be up, down, or sideways. First, see what the chart is doing.
- Look at the overall trend.
- Check the Relative Strength Index (RSI) to gauge momentum.
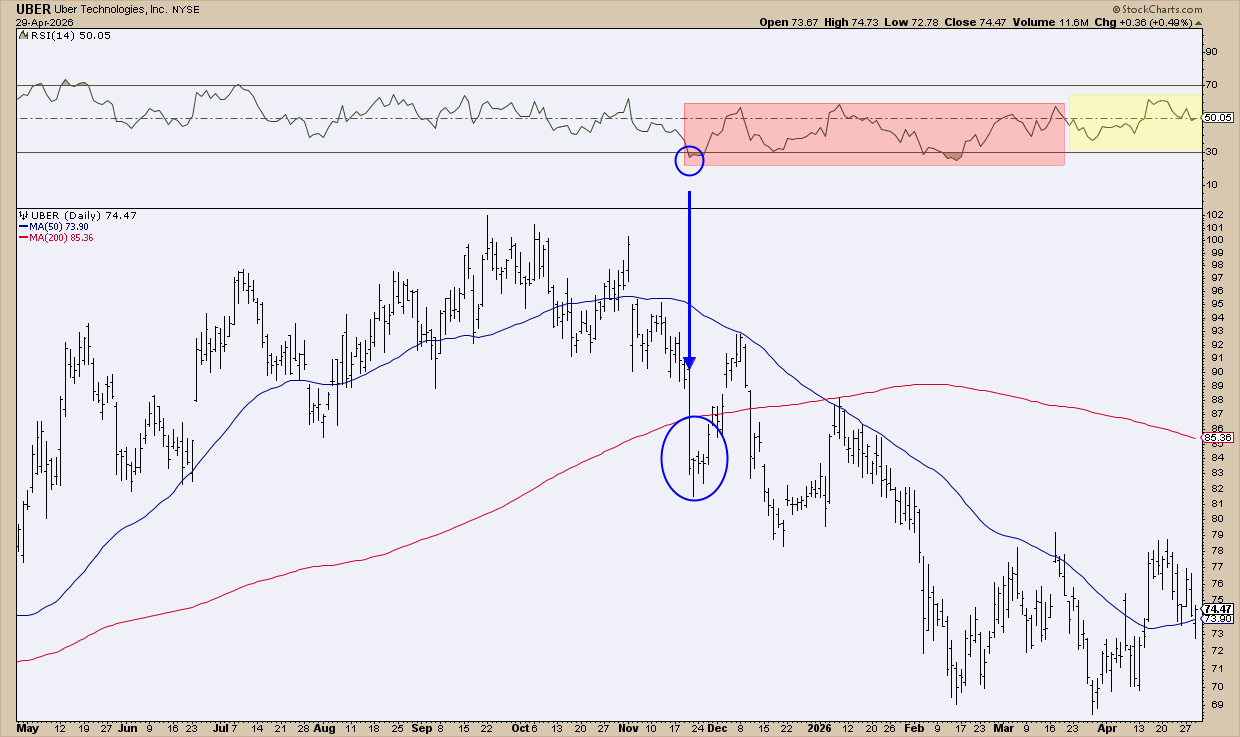
From May to September Uber moved higher, then turned down in October and fell further in November. The RSI fell below 30 and stayed near 60, showing bearish momentum.
Step 4 – Mark Key Levels and Sketch Scenarios
We can’t know the exact outcome, but we can plan for three possibilities: bullish breakout, sideways range, or bearish breakdown.
- Breakout level – the last high.
- Trading range – the area between recent highs and lows.
- Breakdown level – the last low.
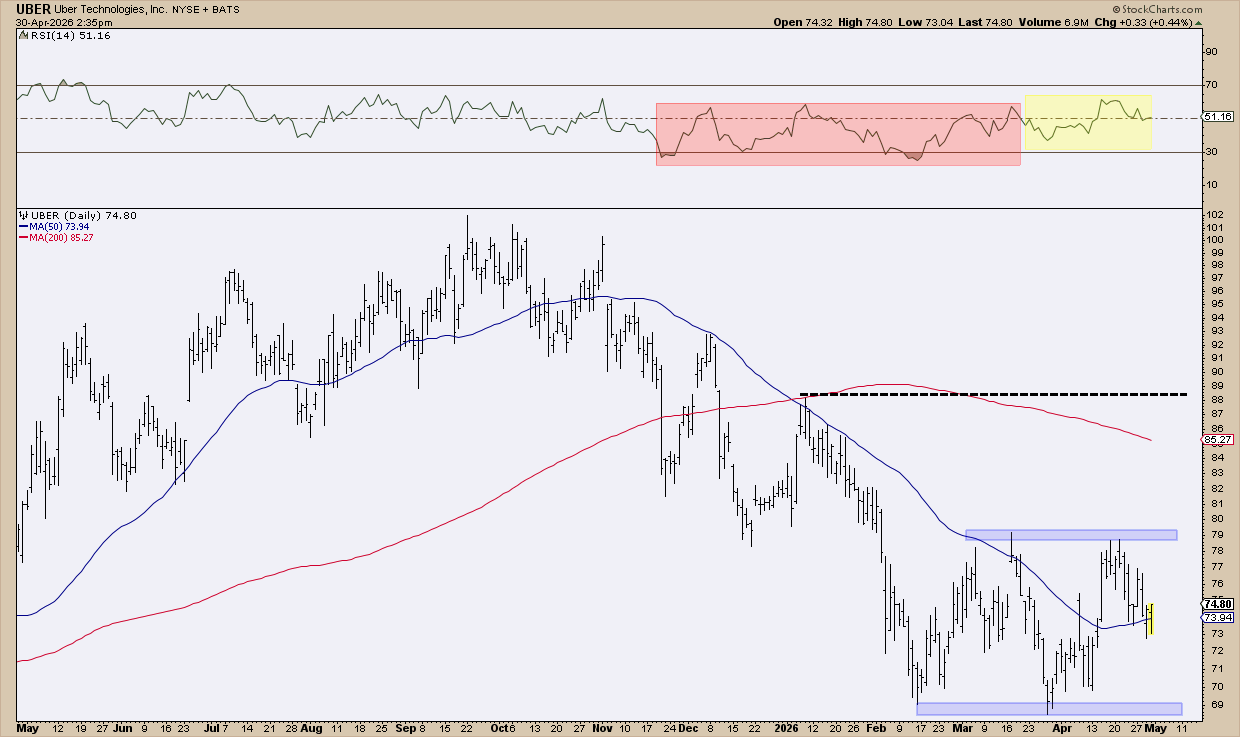
For Uber, the simple map looks like this:
- Above $79 – first sign of bullish intent.
- Between $69‑$79 – likely a false breakout, staying neutral.
- Below $69 – bearish control, more downside risk.
If the price stays above $79 and also holds above the 200‑day moving average, a “golden cross” (50‑day crossing above 200‑day) would give extra confidence. If the price falls below $69, the downside scenario becomes stronger.
Step 5 – Compare With Market, Sector, and Competitors
Before deciding, see how the stock moves against the broader market, its sector, and a few peers.
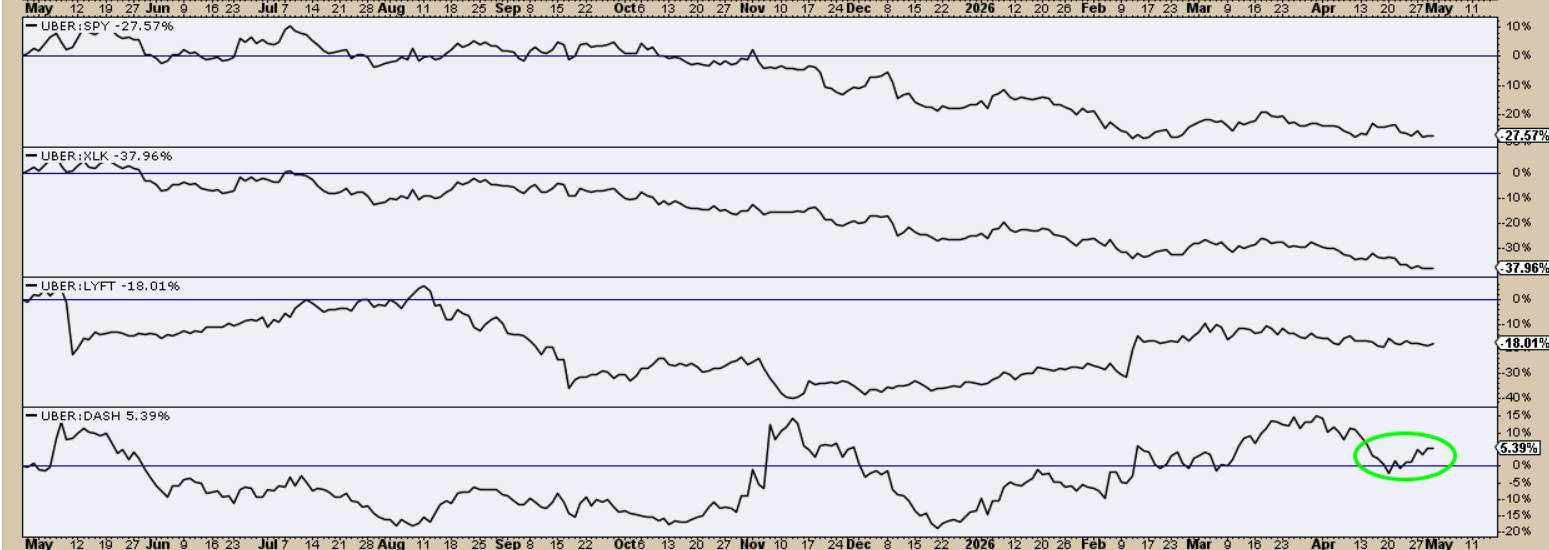
In this view Uber lags behind the S&P 500 and the tech sector, and only slightly outperforms DoorDash. The new growth story must prove itself on the chart before we consider a trade.
Tip 1: Watch the second move after a news release. The first reaction can be noisy; the follow‑up shows real commitment.
Tip 2: Strong breakouts tend to stay above the breakout level. Weak ones often retest that level as support.
Tip 3: When news matches the current trend, the move usually extends farther.
That’s All
Now, when a headline catches your eye, you won’t rush in. You’ll translate the story, map the chart, and wait for the right signal. No FOMO – just a clear plan.
Source: Materials provided by https://articles.stockcharts.com.Note: Content may be edited for style and length.