
Technology Leads, Energy Holds Steady
The S&P 500 moved a little higher this week. The sector rankings did not change. The same five sectors stay on top.
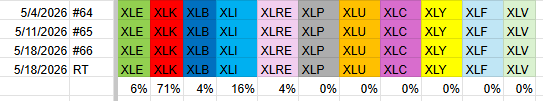
- Energy – XLE (6%)
- Technology – XLK (71%)
- Materials – XLB (4%)
- Industrials – XLI (16%)
- Real Estate – XLRE (4%)
Weekly Relative Rotation Graph (RRG)
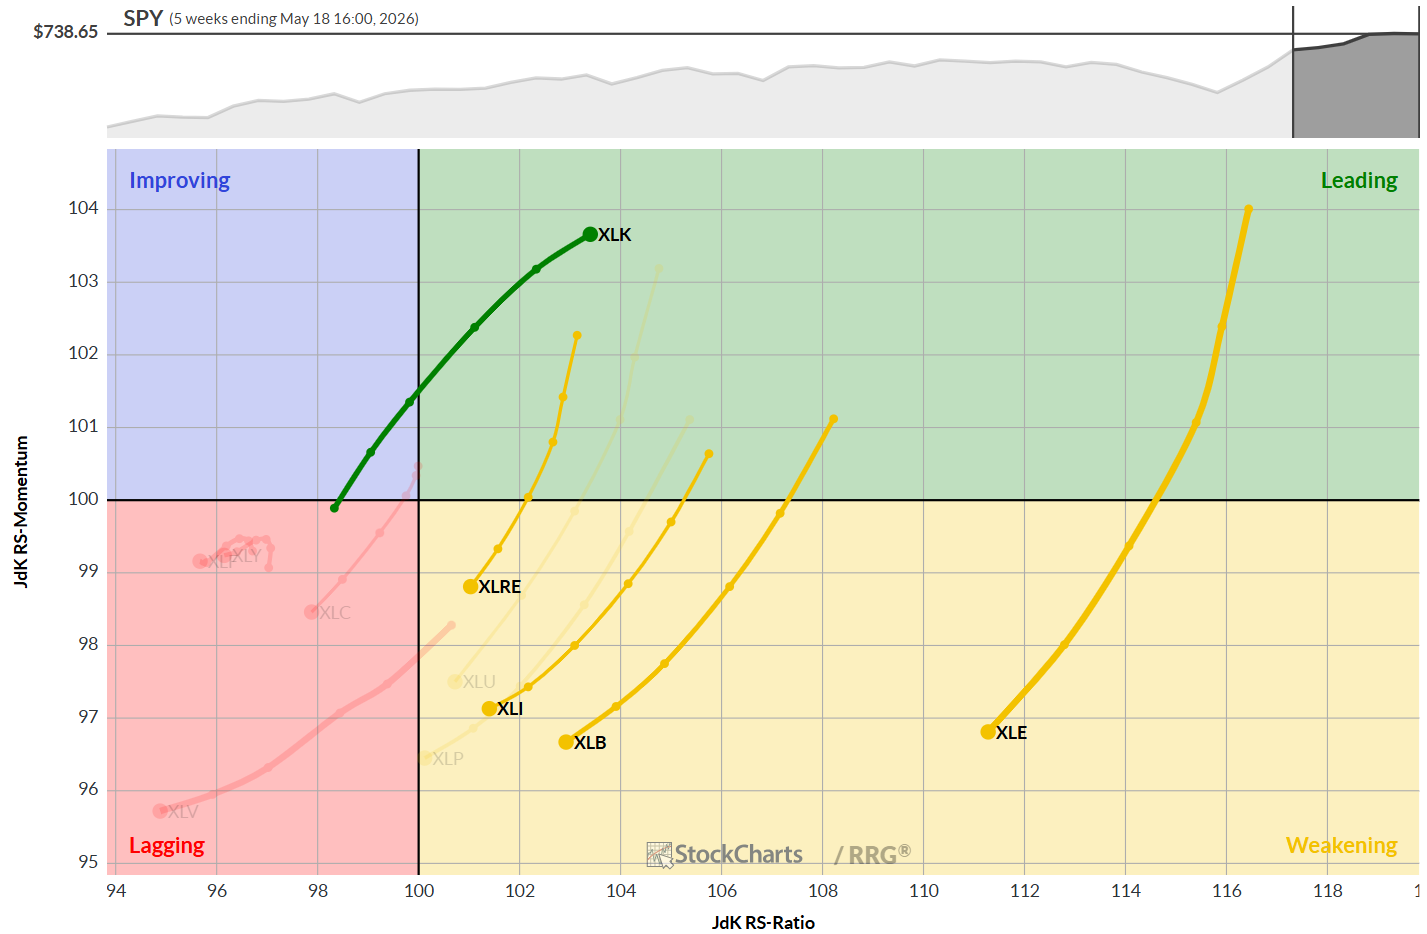
The weekly RRG shows technology as the only sector in the leading quadrant. It also moves upward, which is a good sign. All other top sectors – energy, materials, industrials, and real estate – sit in the weakening quadrant. They are still stronger than most other sectors, which are clustered in the lagging quadrant.
Daily Relative Rotation Graph (RRG)
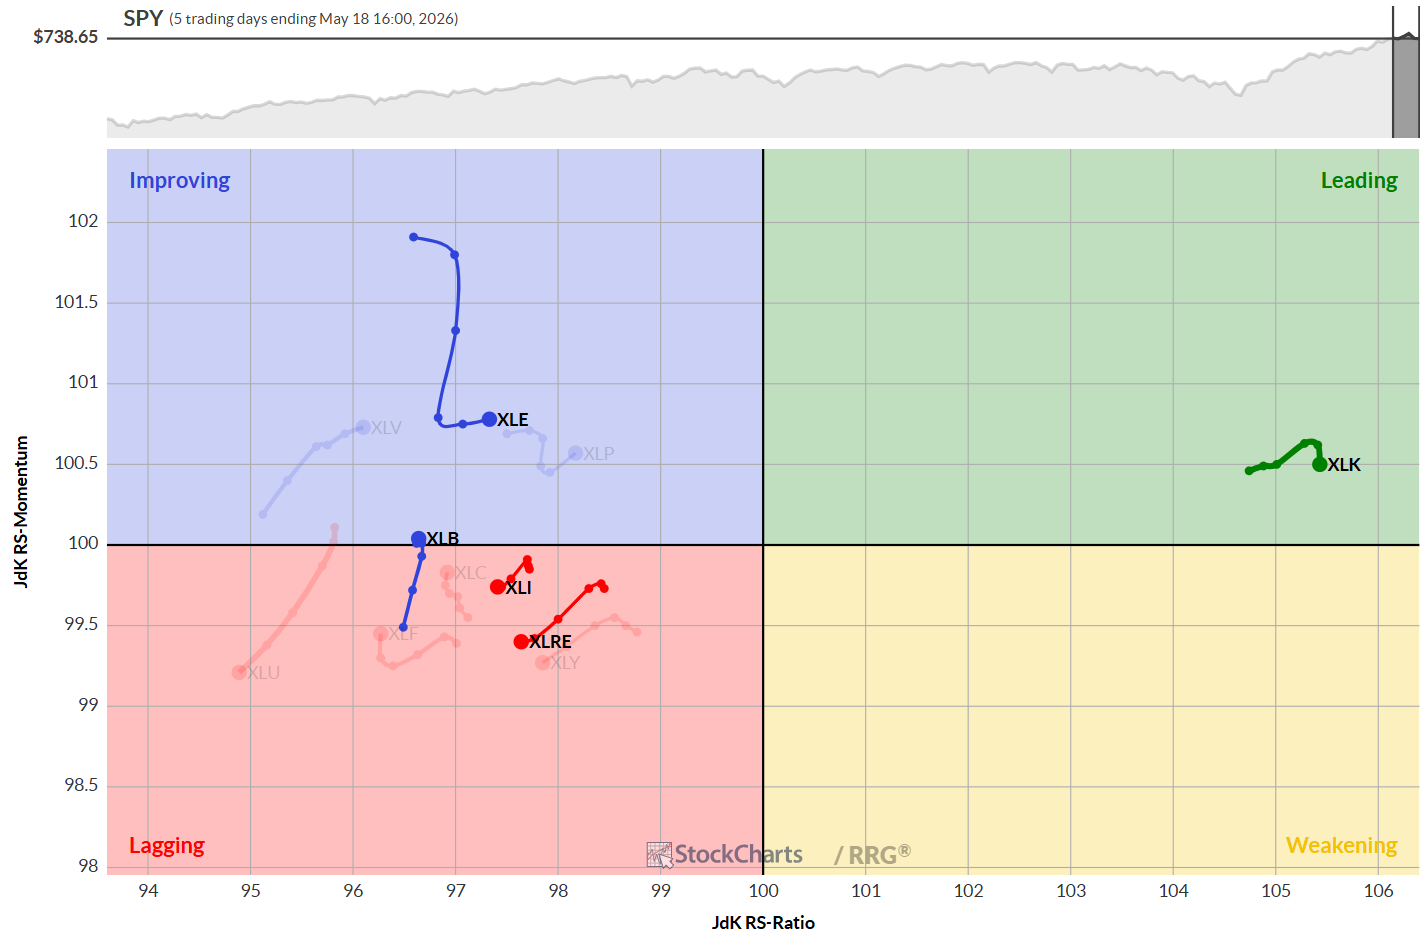
On the daily chart, technology is still the only sector in the leading quadrant and the only one on the right side of the graph. Energy has moved into the improving quadrant and is starting to rise. Materials is almost vertical and is about to cross into improving as well. Industrials and real estate remain in the lagging quadrant.
Sector Highlights
Energy
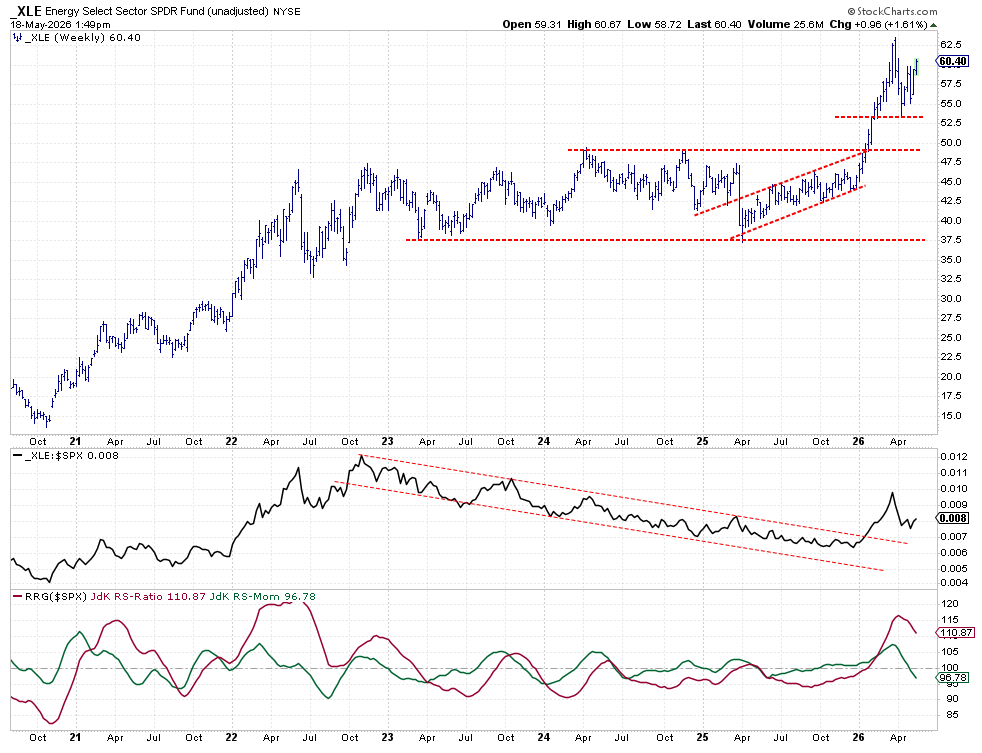
Energy has broken above its recent high. The price line looks stronger, and the raw relative‑strength line is also improving. The sector may keep its top spot.
Technology
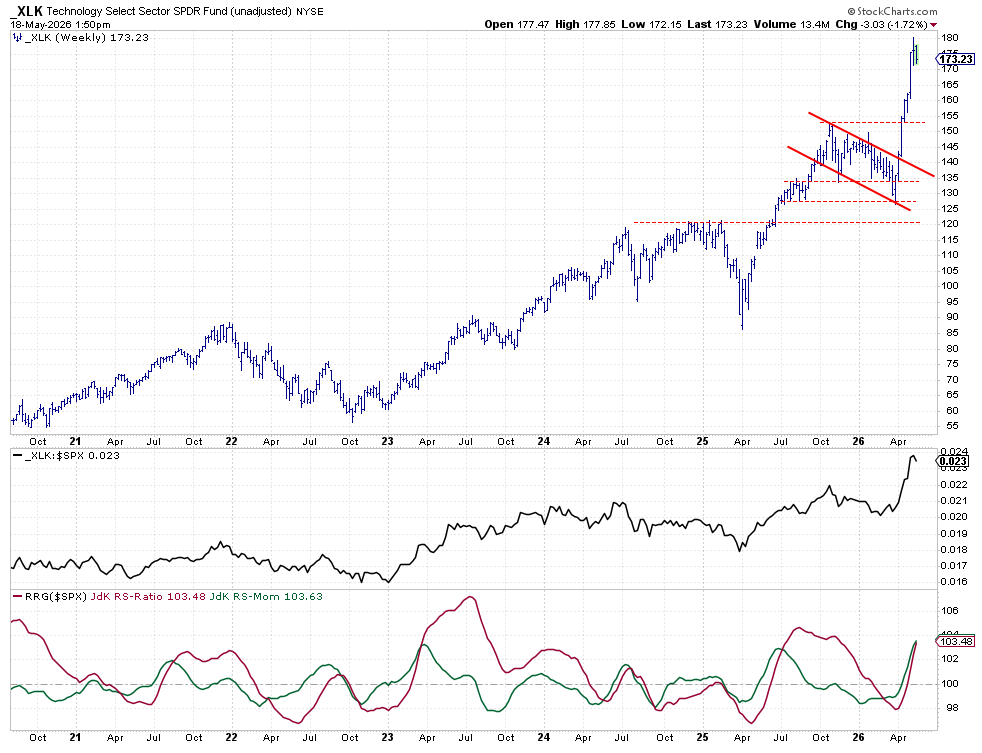
Technology is the strongest sector right now. It has broken out of a tight range. A short‑term pull‑back to about 152.5 is possible, but it should not stop the overall uptrend.
Materials
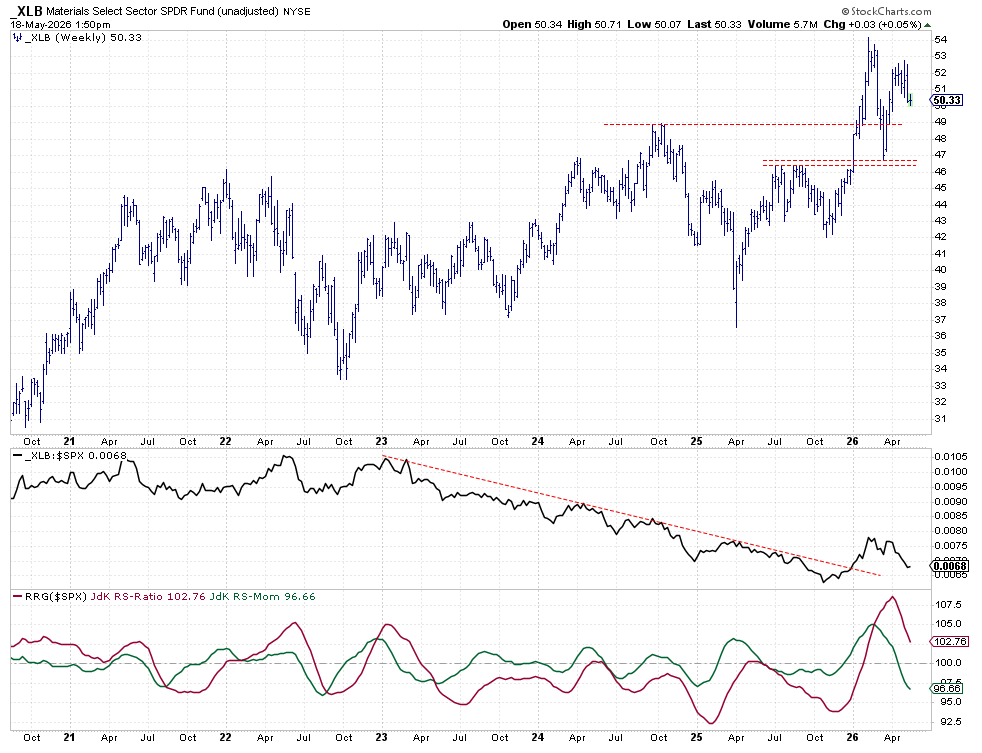
Materials is slipping a little on both the price and strength charts. It sits in the weakening quadrant, so it needs a boost in relative strength to stay in the top five.
Industrials
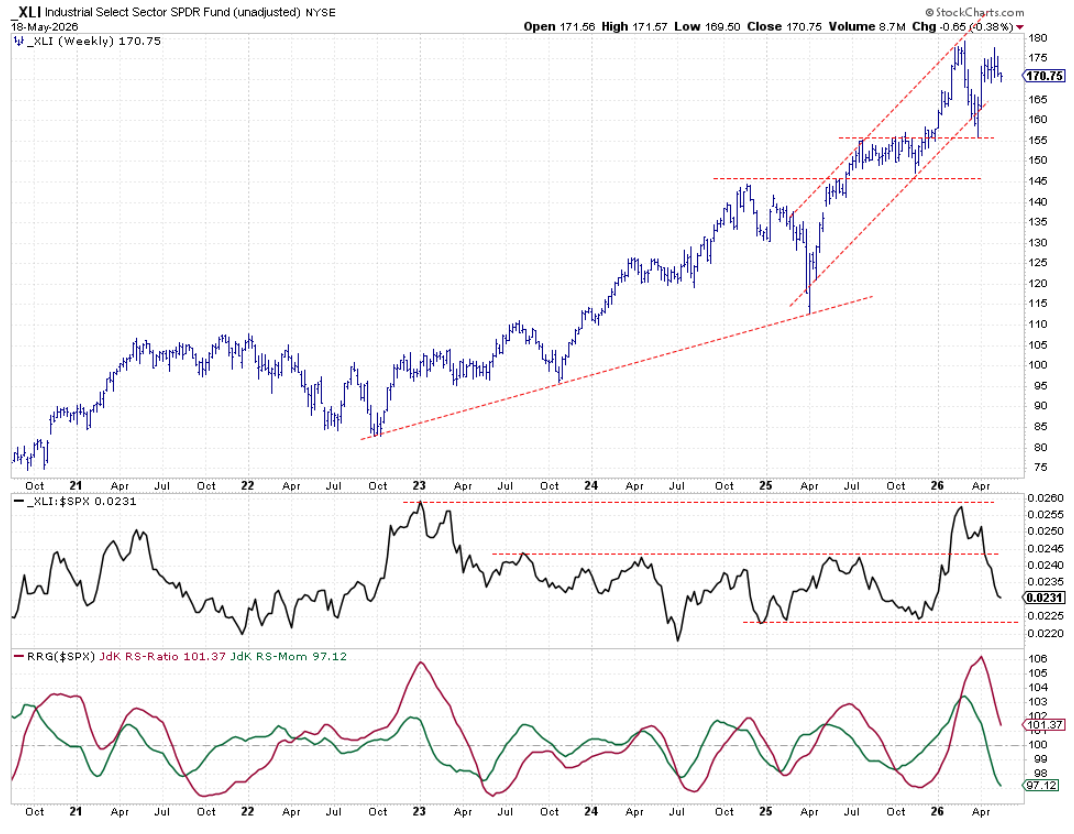
Industrials are moving inside a rising channel but have been flat for six weeks. The raw strength line is falling fast, and the sector sits in the weakening quadrant. It needs stronger relative strength soon.
Real Estate
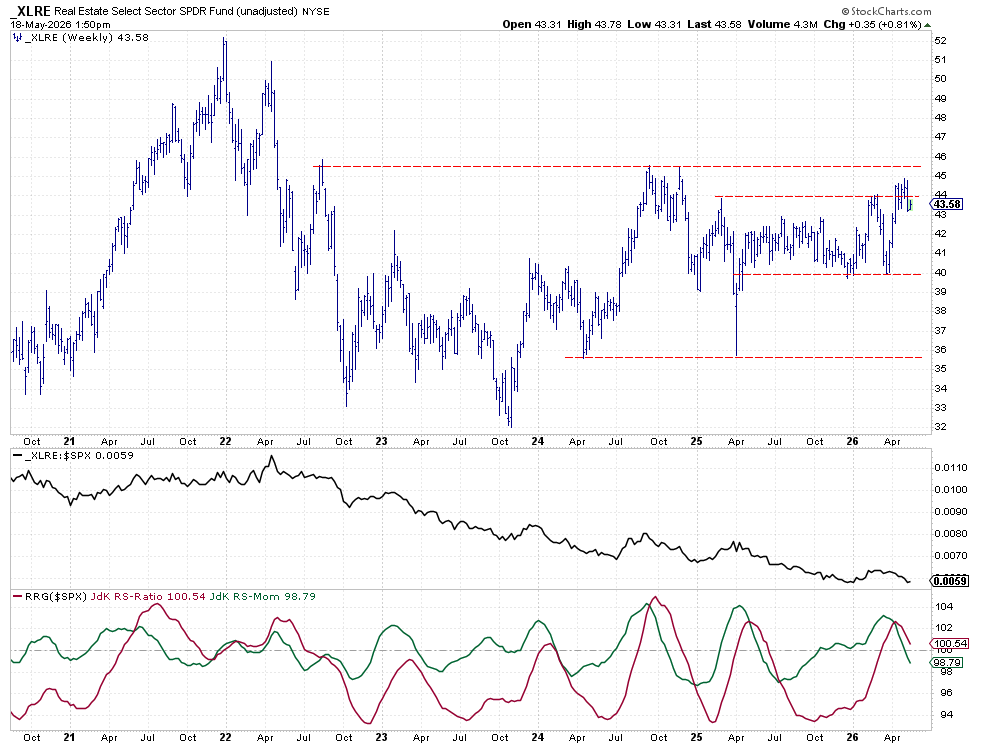
Real Estate is near a horizontal resistance level around 44. It dipped below last week, then started to climb again, but the move is not decisive yet. The sector stays in the weakening quadrant.
Portfolio Performance
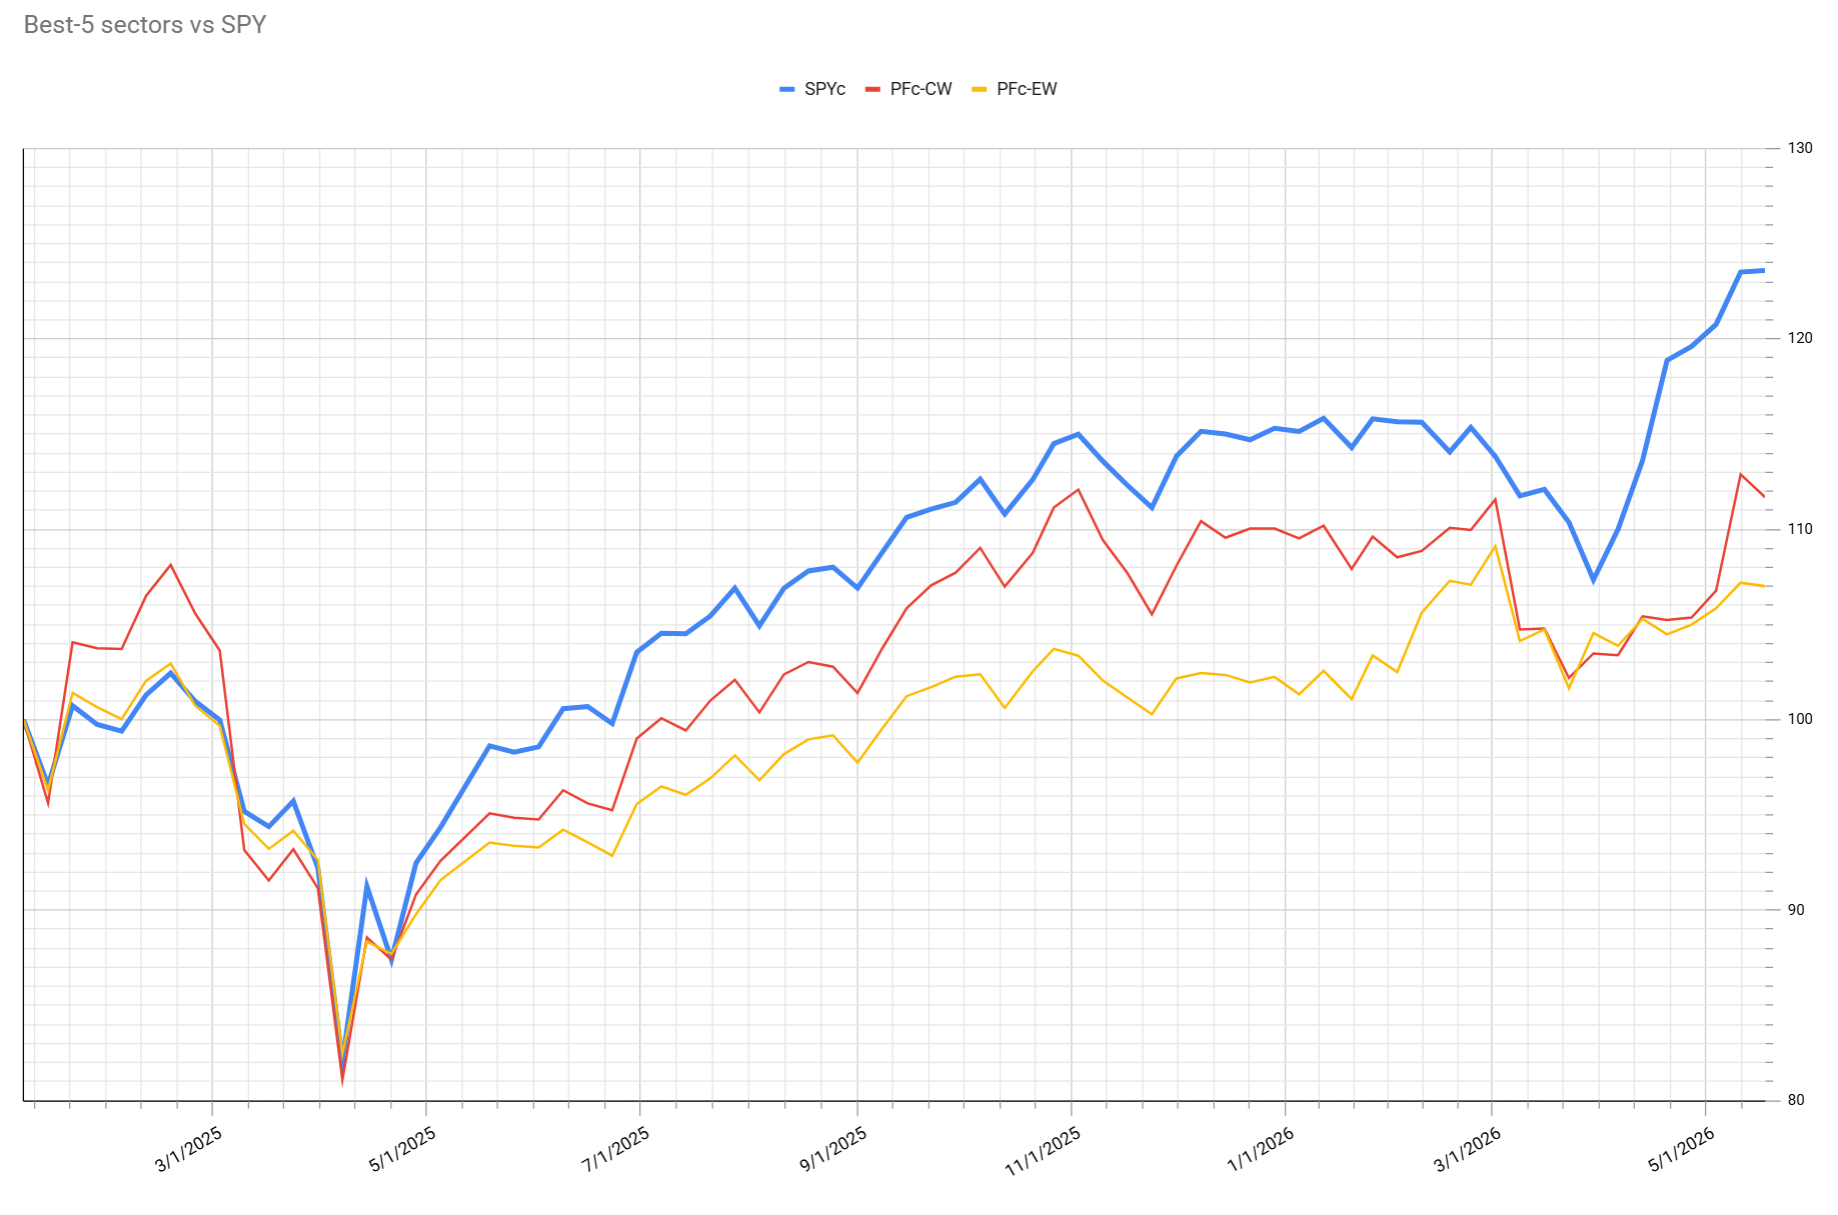
The portfolio fell about 1% this week, putting it a little farther behind the S&P 500. The drop is mainly because technology makes up about 70% of the portfolio. When tech moves flat, the whole portfolio feels the impact.
We are watching the top five sectors closely. A strong rally in the leading sectors could lift the portfolio back up.
#StayAlert
Source: Materials provided by https://articles.stockcharts.com.Note: Content may be edited for style and length.