
Market snapshot
The Paris stock market ended the day higher. The CAC 40 cash index finished at 7,987.49 points, a gain of 0.44% on a trading volume of €4.1 billion.
Why the market moved
Oil prices kept climbing, which added pressure on inflation expectations. Higher inflation makes central banks think about tightening monetary policy. At the same time, U.S. Treasury yields rose across the curve, with the 30‑year rate hitting a near‑three‑year high. In Europe, the 10‑year French OAT yield rose to 3.97%.
These moves created uncertainty in equity markets. Investors who expected a monetary easing in the U.S. by the end of February now see a possible tightening early next year if inflation stays high.
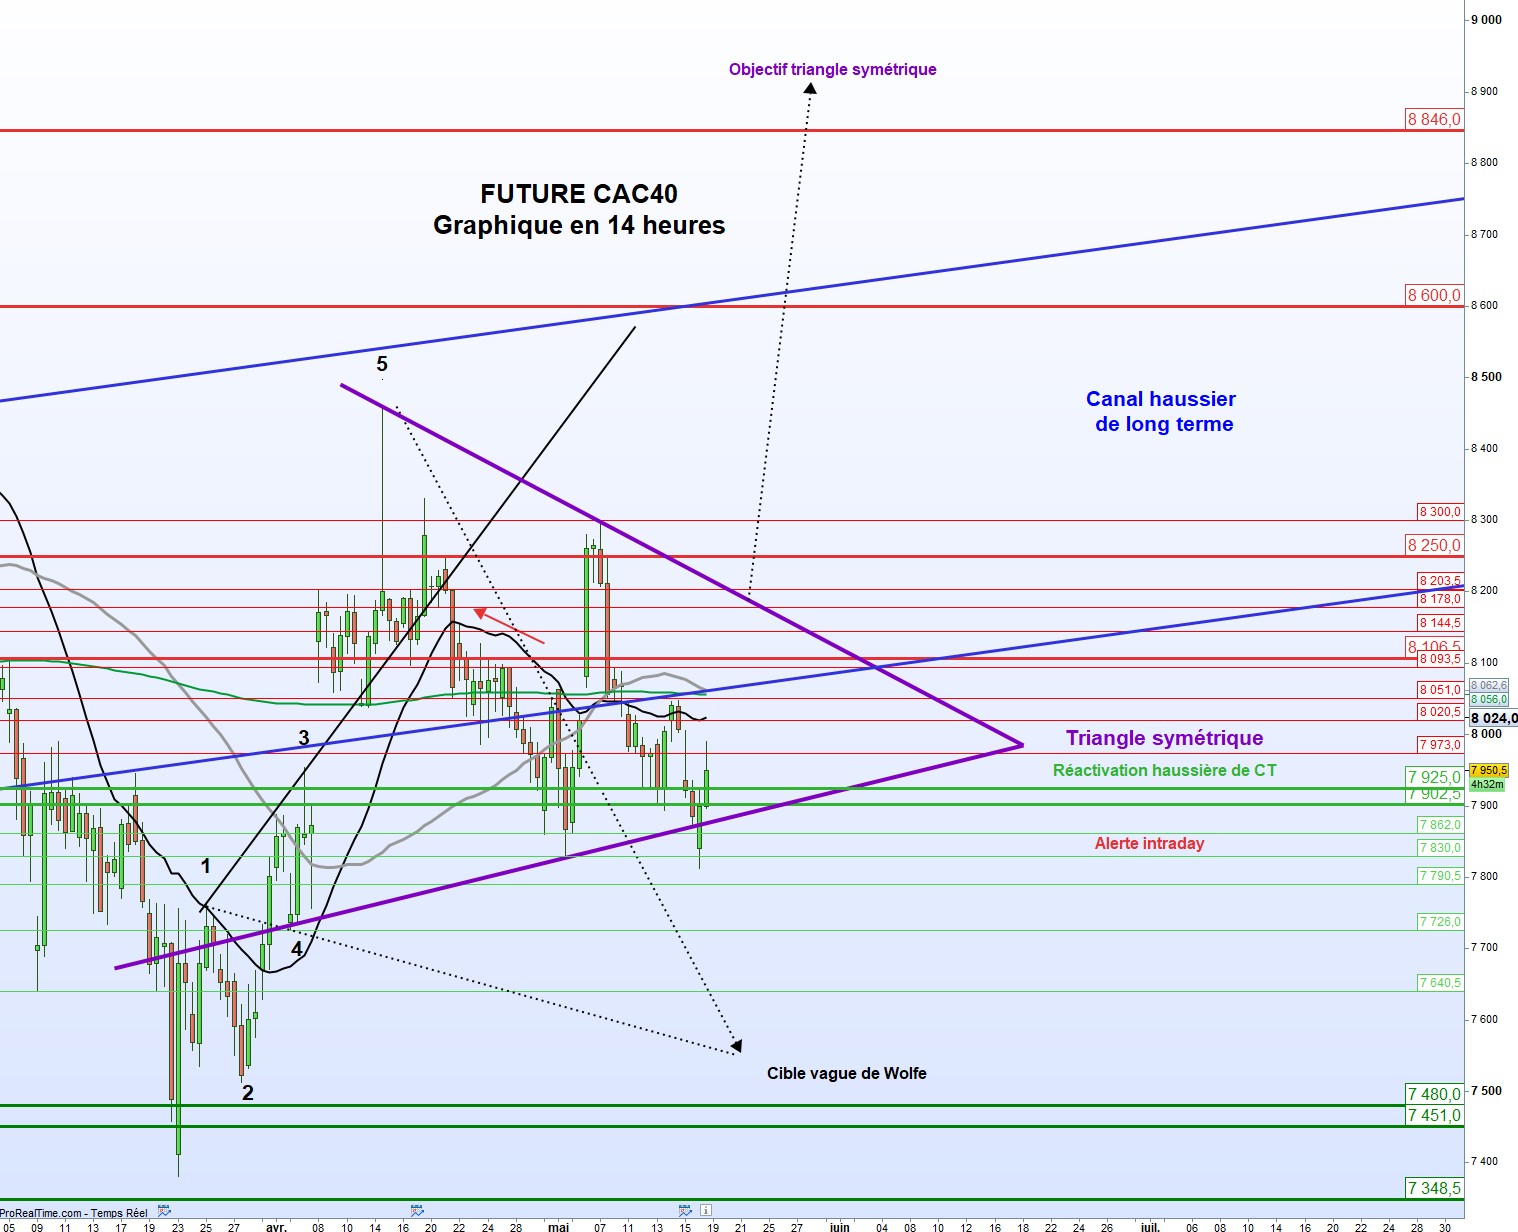
June CAC 40 future – key levels
Resistance (price levels that could stop a rise): 7,973 → 8,020.5 → 8,051 → 8,093.5 → 8,106.5 → 8,144.5 → 8,178 → 8,203.5 → 8,250 → 8,300 → 8,600 → 8,846 → 9,250.
Support (price levels that could stop a fall): 7,925/7,902.5 → 7,862 → 7,830 → 7,790.5 → 7,726 → 7,640.5 → zone 7,480/7,451 → 7,348.5 → 7,296 → 6,964.
The market is trending upward as long as price stays above the 7,902.5‑7,925 zone.
What the chart is showing
At 14:00 GMT the June future opened with a small gap down, just below the lower edge of a symmetric triangle that sits at about 7,873 points. The triangle was respected at the end of last week.
If the price briefly falls under the triangle’s lower line and then climbs back, the pattern stays valid. In that case the next target would be the triangle’s upper edge around 8,217 points. A firm break above the upward‑sloping channel near 8,060 points would end the sideways consolidation that began in early April and could push the price toward the triangle’s top at 8,915 points. To reach the higher channel ceiling near 8,600 points, a strong positive catalyst would be needed.
On the flip side, closing below the triangle’s lower edge would signal a return to consolidation. The next target would be the Wolfe wave level near 7,550 points, with a possible extension toward the support band between 7,480 and 7,451 points. A break below that band could restart a downtrend toward the “neckline” of a triple‑top pattern formed since May 2024. As long as this intermediate support holds, the long‑term bias stays neutral. If it breaks, the index could slide toward 5,800 points.
Bottom line
We still favor a bullish bias and plan to keep long positions as long as the chart pattern holds. We will adjust our exposure if the price breaks key levels and will watch closely for any catalyst that could confirm or reject the pattern.