

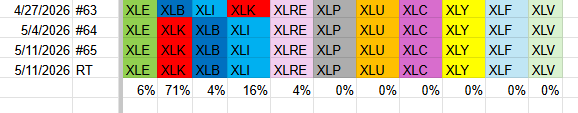
During the last week the S&P 500 rose more than two percent. The ranking of the five strongest sectors did not change. Energy stayed first, then technology, materials, industrials and real estate.
- Energy – XLE (6%)
- Technology – XLK (71%)
- Materials – XLB (4%)
- Industrials – XLI (16%)
- Real Estate – XLRE (4%)
Weekly Relative Rotation Graph
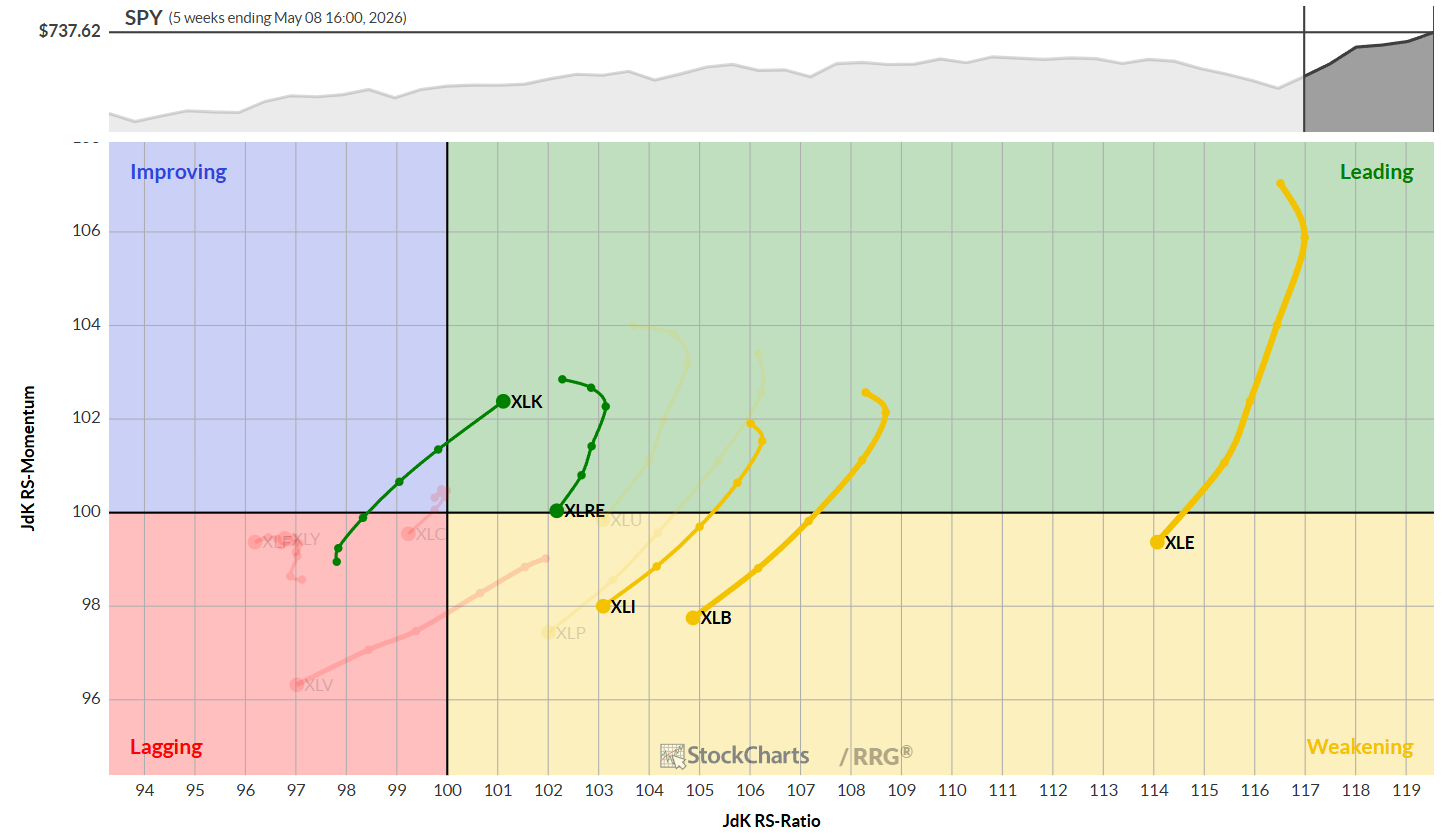
Technology moved clearly into the leading quadrant. It shows a strong heading and the fastest rotation among all groups. The other four top sectors are still in the weakening quadrant, but they keep high RS‑Ratio numbers, so they stay in the top‑five basket.
Daily Relative Rotation Graph
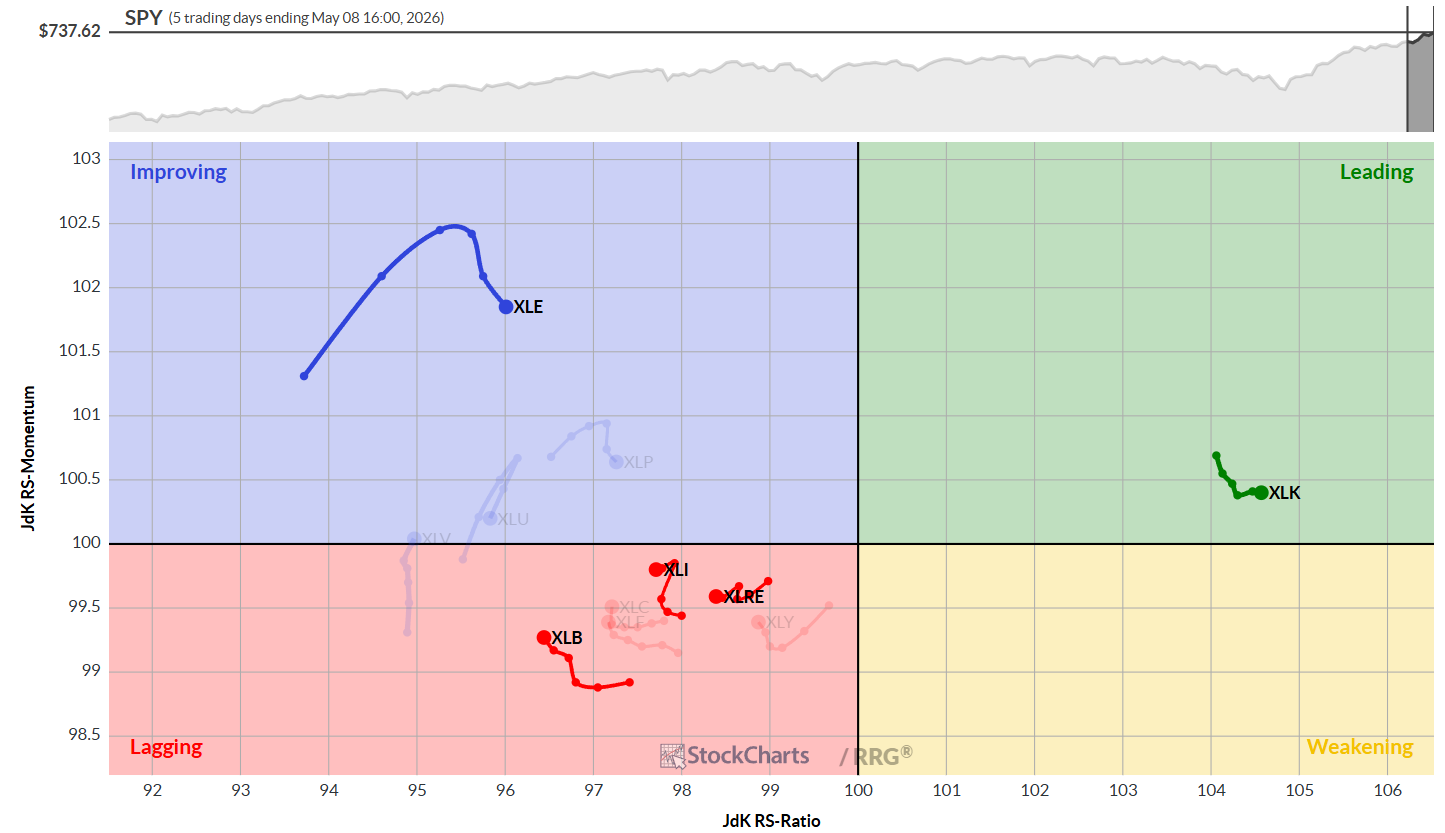
On the daily chart, technology is the only sector in the leading quadrant. It lost a little momentum but still climbs higher on the RS‑ratio scale.
Materials, industrials and real estate sit in the lagging quadrant. Their short tails show steady performance. Materials and industrials are gaining a bit of momentum, while real estate stays flat.
Energy sits in the improving quadrant. It is slipping on the RS‑momentum line but keeps rising slowly on the RS‑ratio line. There is still room for energy to move back to the leading quadrant.
Energy
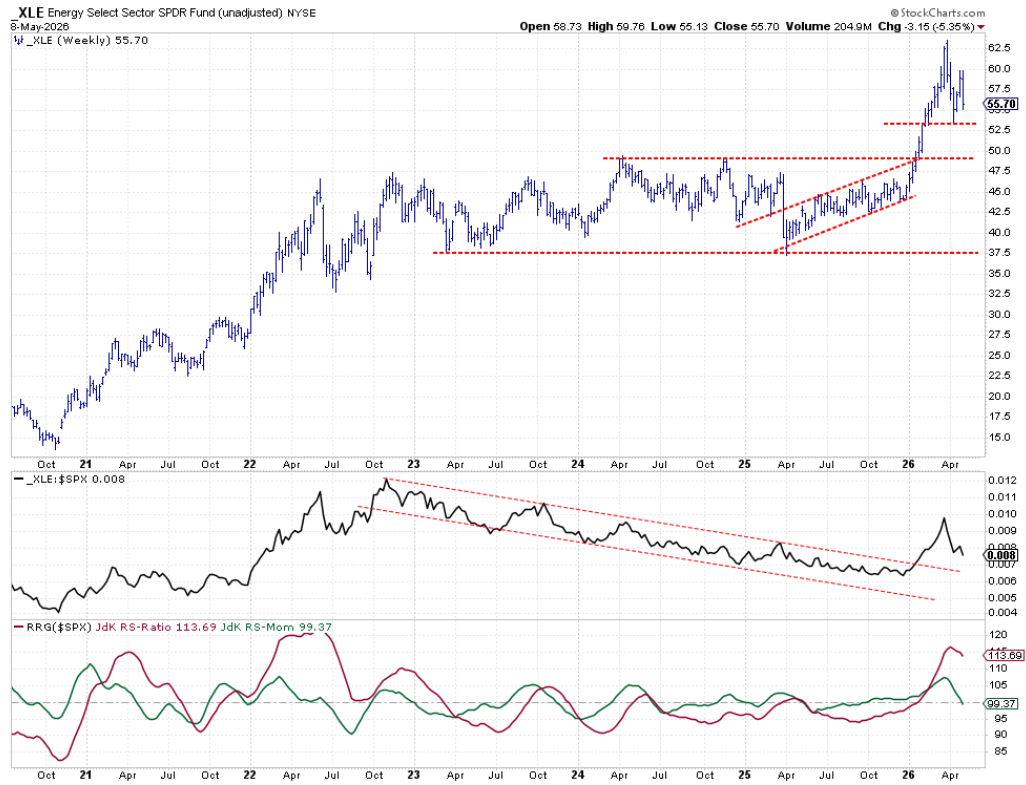
Energy formed a lower high after a higher low, which means the price is moving sideways. The raw RS line is turning down, but the RS‑ratio stays high, keeping energy as the strongest sector.
Technology
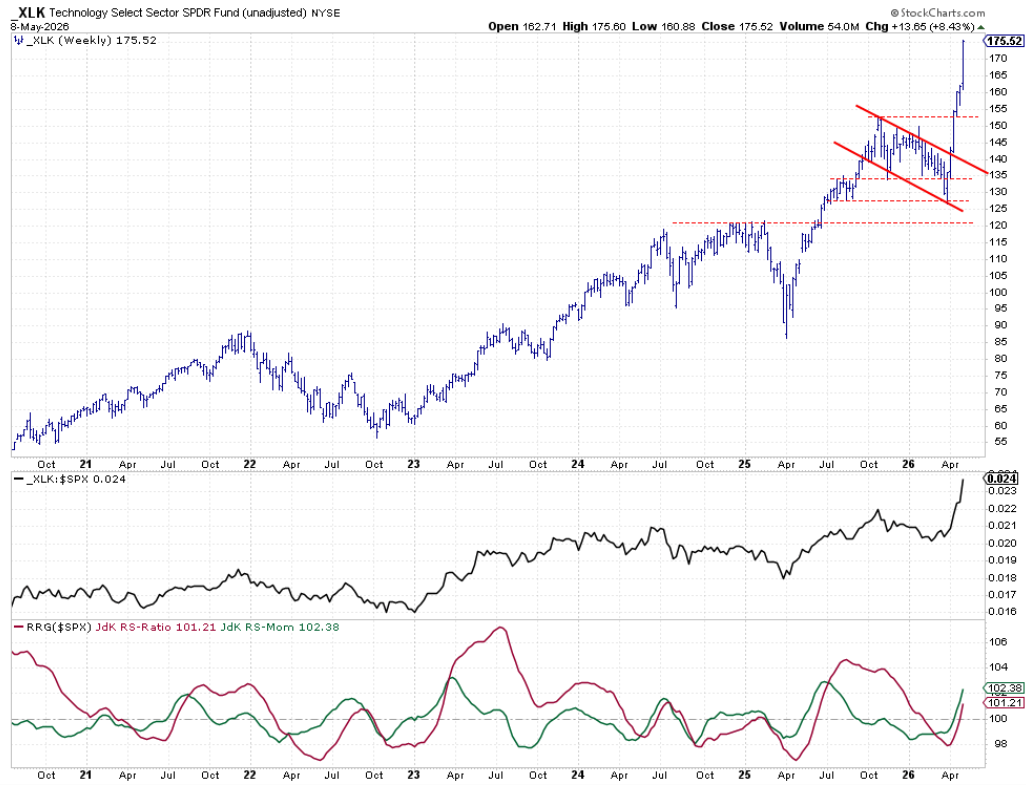
Technology kept its fast rally. It reached a new high last week and finished near that level. Both RS lines are above 100, confirming strong heading and leadership.
Materials
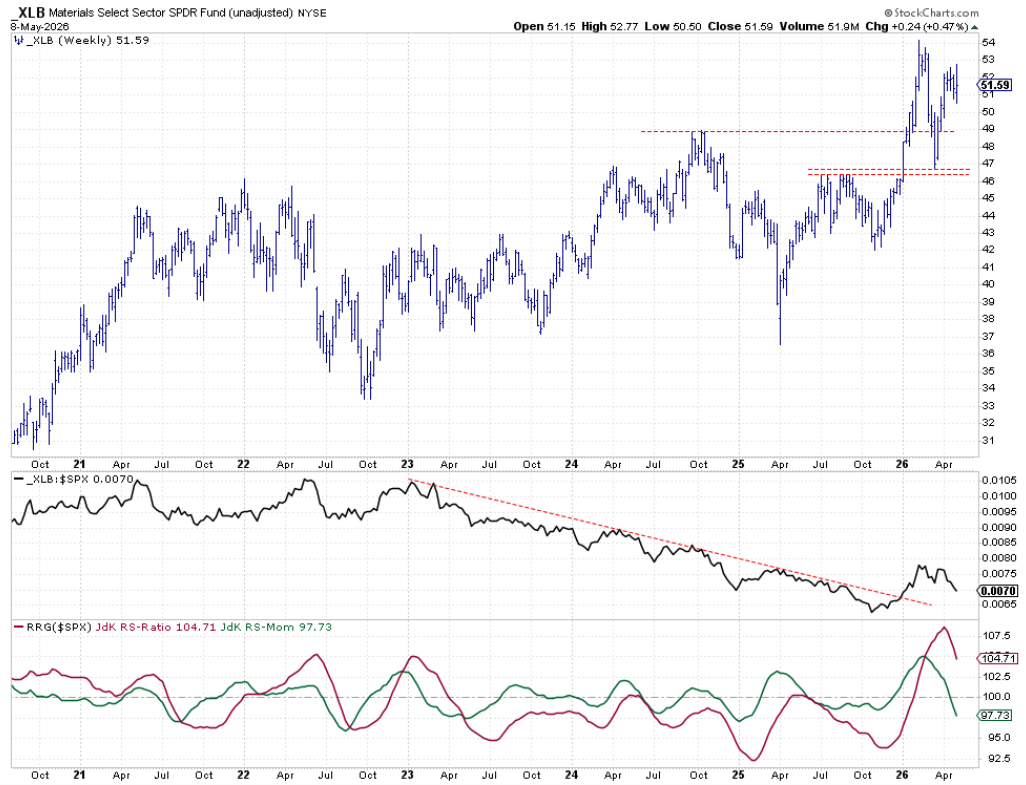
Materials started to trade sideways. The raw RS line made a small double‑top, hinting at possible weakness soon. RS‑Momentum fell below 100, pulling the RS‑ratio down, but the sector still stays in the top five.
Industrials
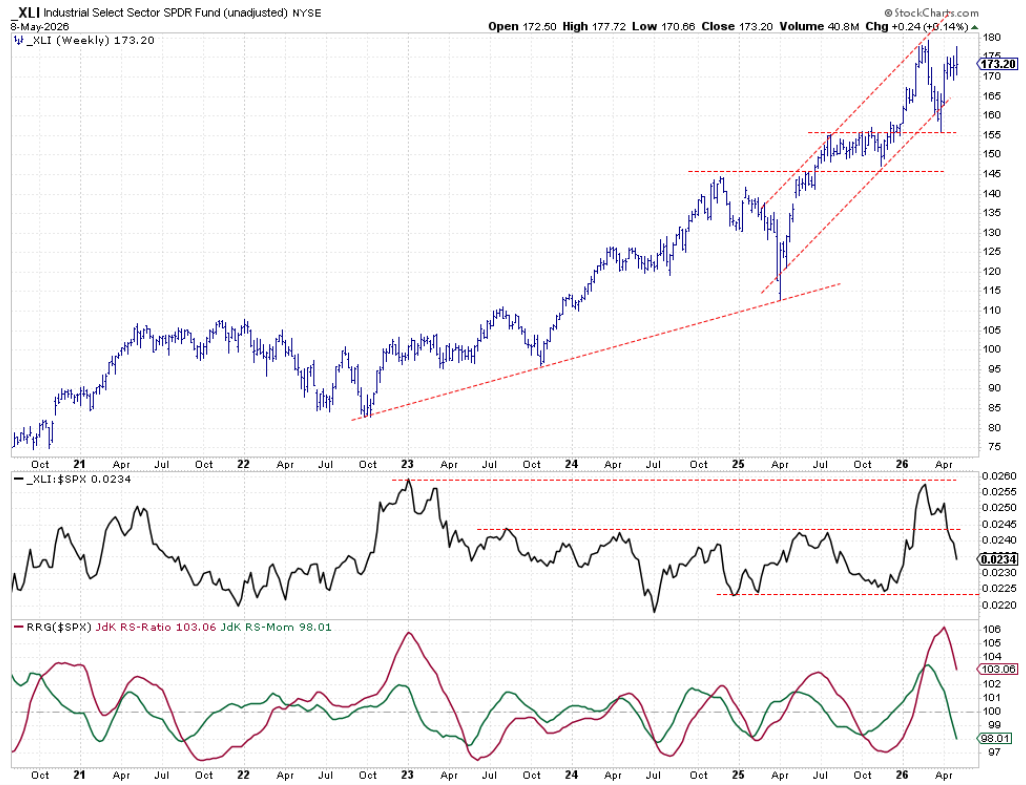
Industrials also moved sideways in a range that lasted three to four weeks. The RS line now shows lower highs and lower lows, pushing the sector back into its long‑term range. RS‑Momentum is below 100, and the sector sits in the weakening quadrant.
Real Estate
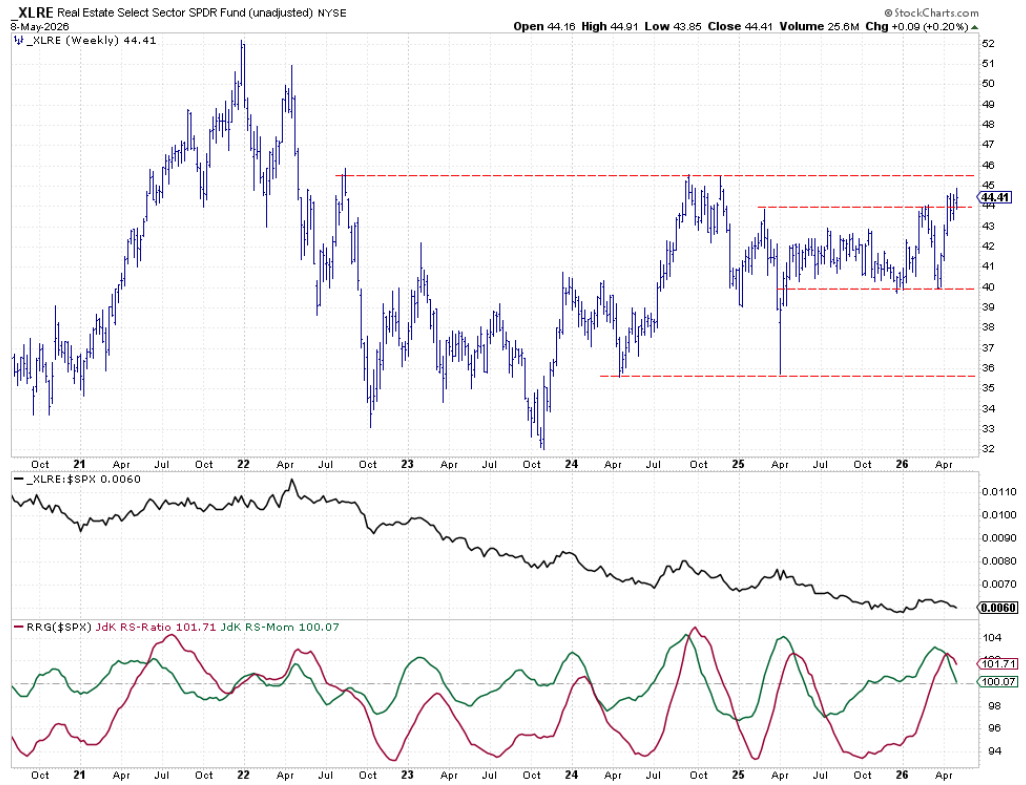
Real estate stays well above its breakout level, which is a good sign. It is close to the next resistance around 45.50. The RS line shows a pattern of lower highs and lower lows, but a first higher low may appear soon. The RRG tail is near the weakening quadrant.
Portfolio Performance
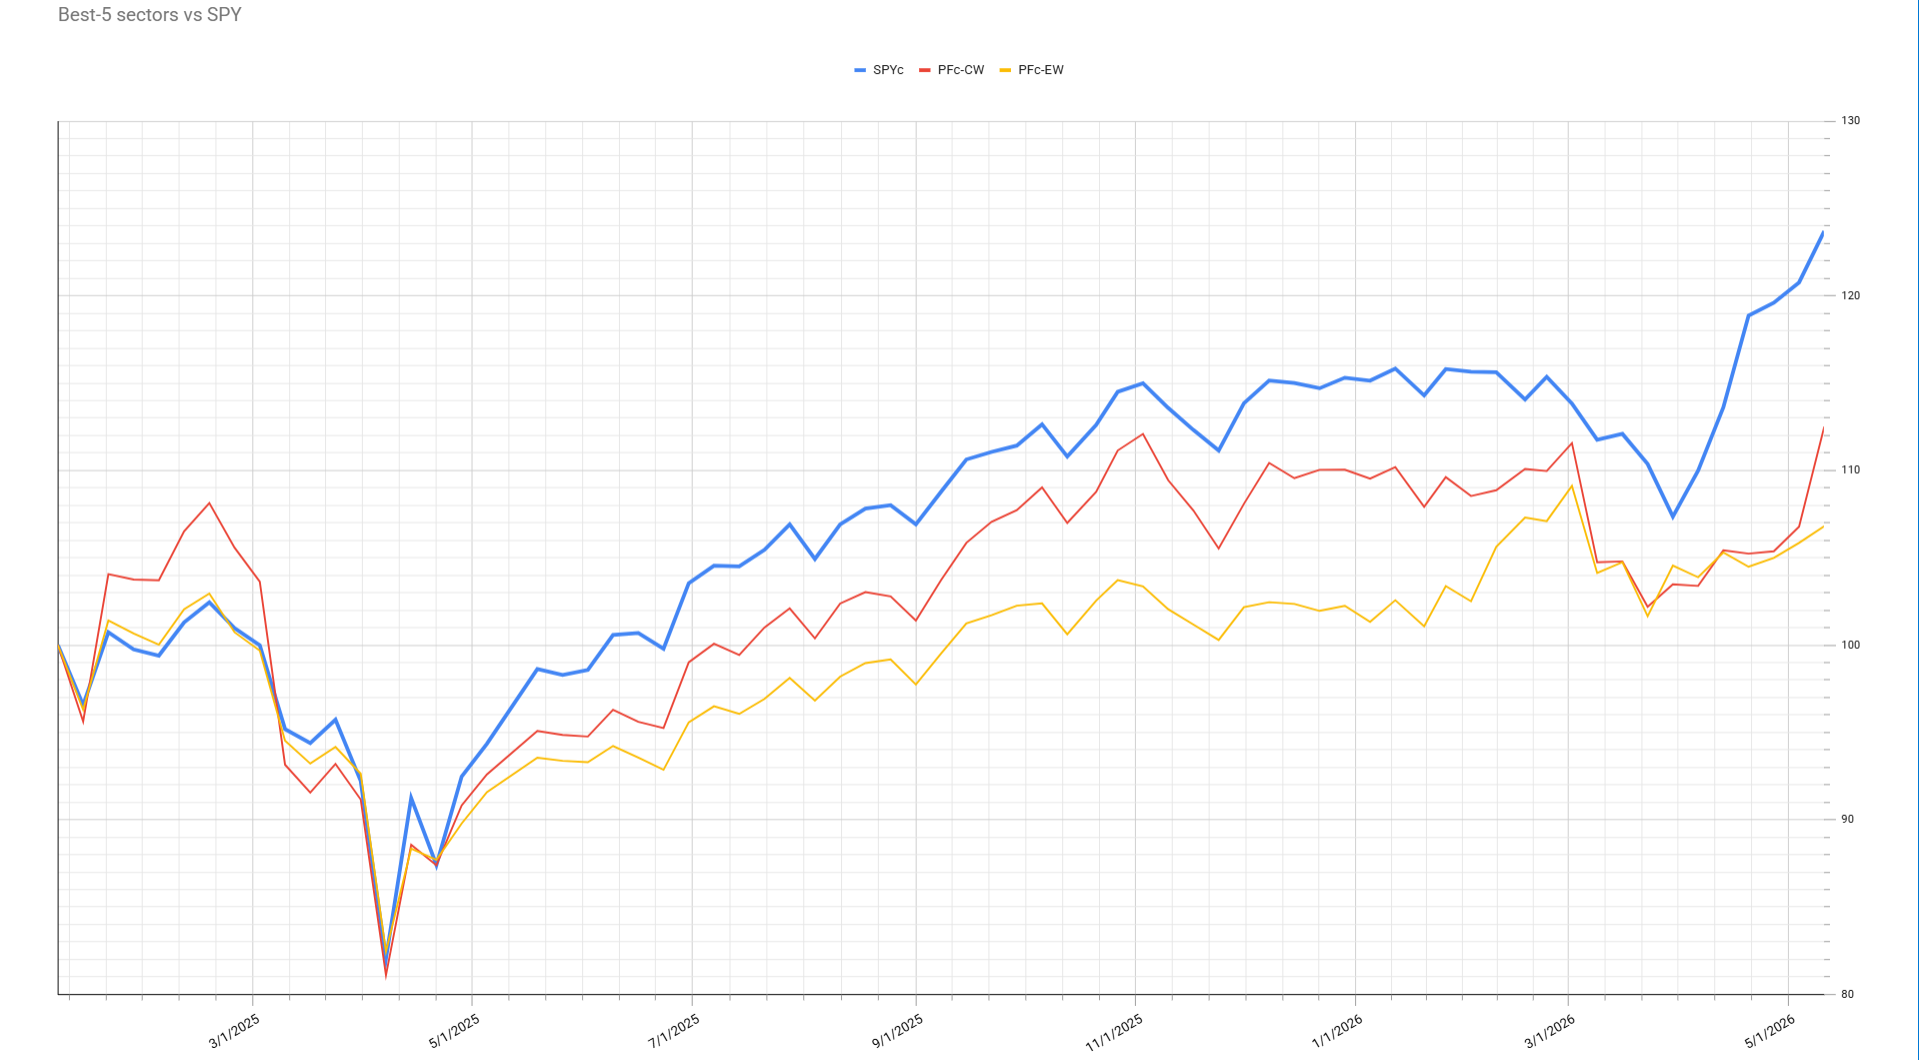
The cap‑weighted portfolio performed strongly last week. By weighting sectors by market cap, it caught up to the S&P 500 quickly. In fact, it beat the index, cutting the lag by almost four percent. These moves can happen fast when the portfolio matches market trends. While more time is needed to fully close the gap, weeks like this help overall returns.
Source: Materials provided by https://articles.stockcharts.com.Note: Content may be edited for style and length.