
CAC 40 Daily Update
The CAC 40 cash index closed down 0.69% at 8,056.38 points, with an average volume of €4.0 billion.
Paris stocks stayed in the red on Monday. Hopes for a peace deal faded after President Trump rejected Iran’s counter‑proposal, which asked for sanctions to be lifted, frozen assets returned, and sovereignty over the Strait of Hormuz recognized. Recent attacks in the region show the tension is still high.
Because of the unrest, oil prices went up. Brent crude rose back to $106 per barrel after falling to about $96 last week, bringing back worries about inflation and its effect on world growth.
Iran continues to disrupt traffic in the Strait of Hormuz, while the United States has kept a blockade on Iranian ports since April 13. This issue will likely be a big topic when Donald Trump meets Chinese President Xi Jinping on May 14‑15, since China is the main buyer of Iranian oil.
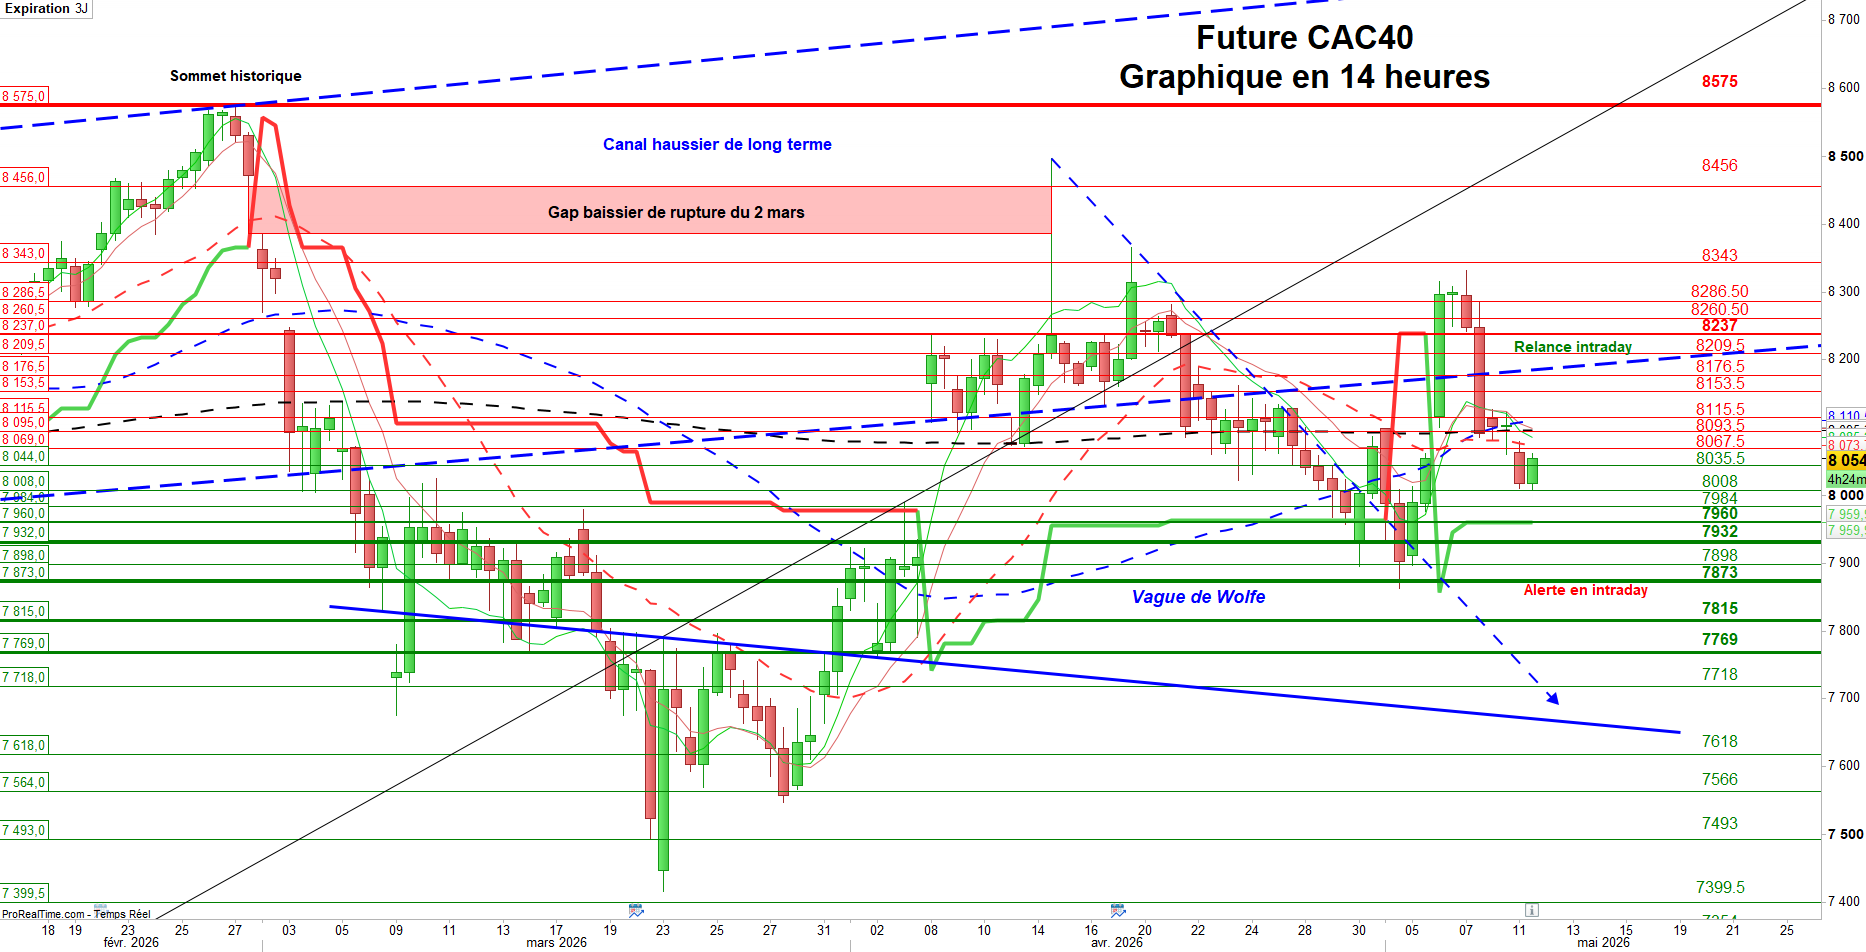
May Futures – Key Levels
Resistance: 8,067 | 8,093.5 | 8,115 | 8,153.5 | 8,209.5 | 8,237 | 8,286 | 8,332 | 8,475 | 8,652.5
Support: 8,008 | 7,984 | 7,961 | 7,834 | 7,719 | 7,669 | 7,540.5
During the trading day, the bias turns bearish when the index falls below 8,108 points.
Technical Picture
At 14:00, the CAC 40 futures tried to restart a consolidation phase after last week’s strong test of the lower edge of the long‑term up‑trend channel. The bounce was quickly erased, leaving investors doubtful and putting the rebound scenario on hold.
For the market to move up again, it first needs to cross its 20‑period and 50‑period moving averages (8,077 and 8,107 points at 14 h). After that, the next hurdle is the lower edge of the trading range at 8,210 points – a level that must stay above for two or three consecutive sessions to be considered a real break.
Technical indicators show weakening momentum: the MACD histogram is heading toward negative territory, the RSI is sliding down, and volumes are flat or slightly lower, indicating a hesitant market.
The gap that opened on May 6 has now been filled, ending the brief rebound attempt that began on May 5 and giving sellers the upper hand again.
What to Watch Next
Key support zones are the 50‑week moving average at 7,764 points and the double support area around 7,895 | 7,862.5 points. A clear break of these levels would push the market back into a consolidation phase, aiming for a Wolfe wave target near 7,600 points.
In short, after the short‑term bounce on May 5, we slowed new buying in our Dynamic and Investor portfolios and are now watching for a firm sign that the up‑trend channel can be reclaimed. If the market stays above the key levels, we may add selective positions, but only when technical signals are clear.