
Last week and the whole month were amazing for stocks.
Check the Market Summary page and switch the view to a month. You will see most groups are up. The only one in the red is Dow Utilities.
Even better, the weekly streak column shows the S&P 100, S&P 500, and Russell 1000 have risen for nine weeks straight.
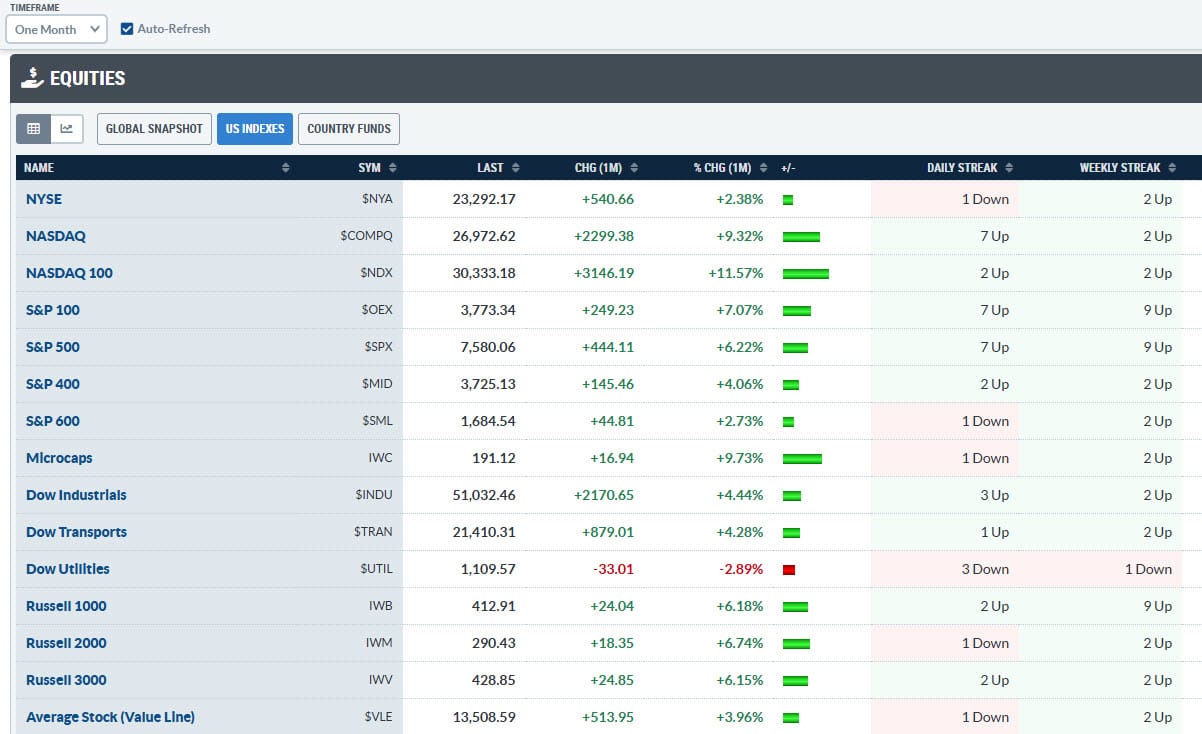
The S&P 500 grew 6.22 % in May, far above its five‑year average of 3.27 %.
That means the old saying “Sell in May and go away” didn’t work this year.
Just like the S&P 500, the Nasdaq Composite and the Dow Jones Industrial Average also hit new record highs. The Dow even closed above 51,000 for the first time.
Strong earnings and excitement around AI helped push prices higher.
The CBOE Volatility Index (VIX) sits at 15.32, showing that traders feel calm.
The NAAIM Exposure Index is 98.38, which tells us that big institutions are still very bullish.
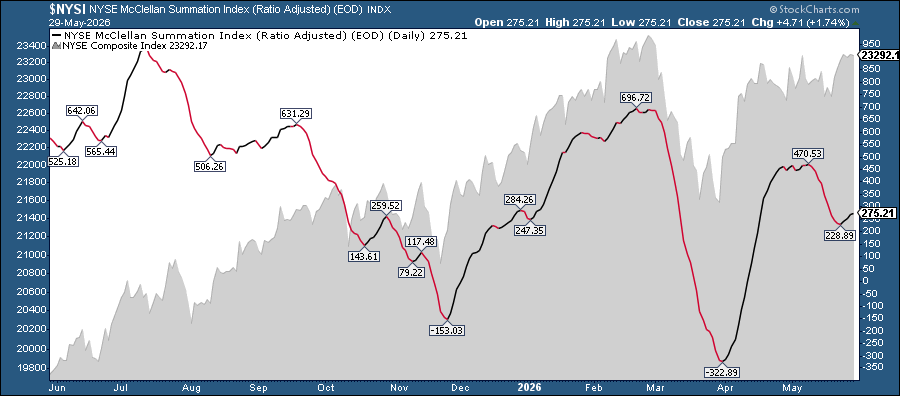
Regular investors look a little more cautious. That’s why I watch two breadth tools: the NYSE Advance‑Decline Line and the NYSE McClellan Summation Index. Both still show expanding breadth.
There isn’t much to dislike about the market right now. With so much optimism, it makes sense to go with the trend.
At the same time, watch what’s happening underneath the price moves. Look at the Market Summary Sentiment and Breadth ChartLists. Check for differences between price action and momentum tools like the RSI, PPO, or MACD.
When the market is hot, listening to experts is even more useful.
What: EarningsBeats Fantasy Stock Draft III
When: Monday, June 1, 2026, at 12 PM ET
Watch Tom Bowley, Julius de Kempenaer, Grayson Roze, and Dave Keller compete and try to beat the StockCharts Technical Rank (SCTR) Team.
Who will win? I’m cheering for SCTR.
👉 Reserve your free seat now
Enjoy the weekend!
Source: Materials provided by https://articles.stockcharts.com.Note: Content may be edited for style and length.