

The market moved up and down a lot last week but stayed inside a narrow range. The Nifty index bounced between 24,090 and 23,485 points and closed near the low end of that range. A sharp fall on Friday was caused by fund flows linked to the MSCI rebalance, which pushed many traders to sell. The India VIX, a fear gauge, jumped 9.6% to 16.19, showing higher nervousness. Overall, Nifty lost 172 points, or about 0.7%.
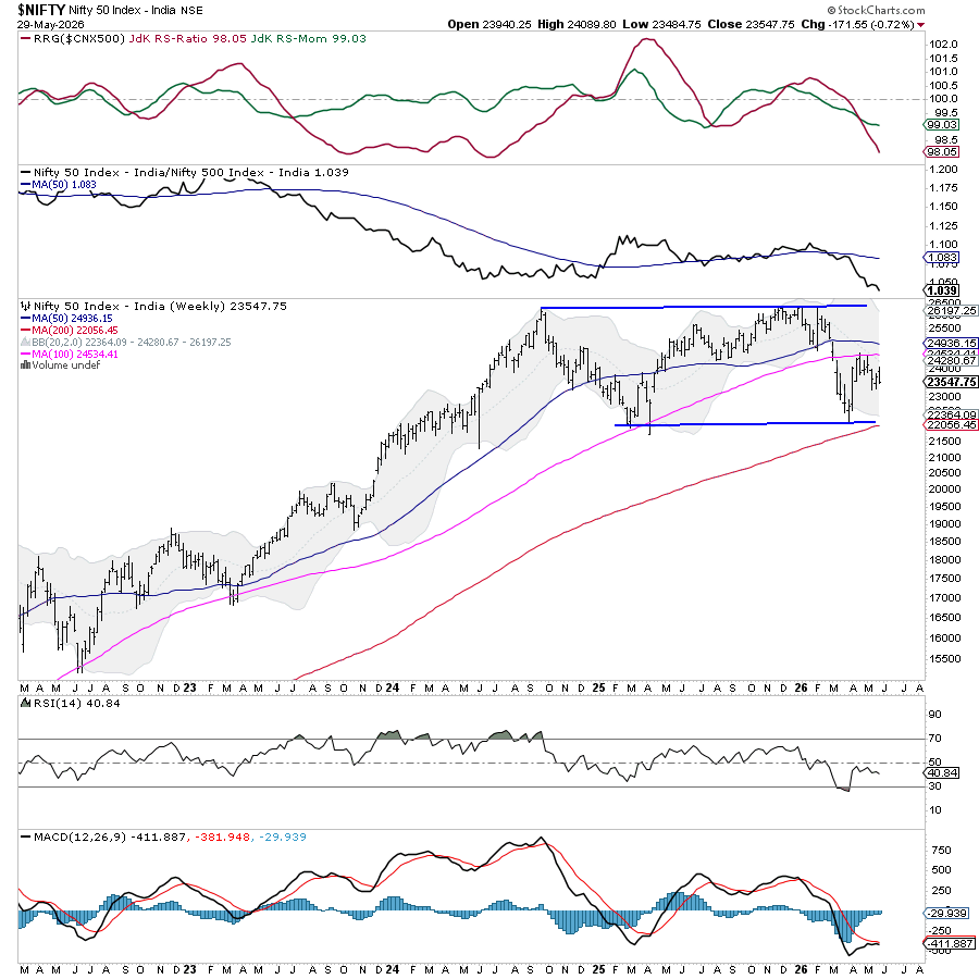
The chart shows that the index is still in a sideways phase. The recent selloff pushed the nearest resistance down to the 23,800 level. As long as the price stays below this line, the market will likely keep consolidating.
Below the index sits a support zone around 23,300‑23,400. Breaking out of either side of this band could set the direction for the next move.
Looking ahead, traders will start the week cautiously. The first resistance levels are 23,800 and 24,000; key support levels are 23,350 and 23,100. Holding above 23,800 would brighten the short‑term outlook and could spark new buying. Falling through 23,300, however, might bring fresh weakness.
The weekly Relative Strength Index (RSI) is 40.8, below the neutral 50, indicating weak momentum. The MACD line sits under its signal line and in negative territory, confirming the lack of bullish thrust.
On the bigger picture, Nifty trades below its 50‑week (≈24,936) and 100‑week (≈24,535) moving averages, showing the intermediate trend is still fragile. It stays above the rising 200‑week average (≈22,057), so the long‑term trend remains intact. The tight channel between support and resistance hints that a clear breakout could happen in the weeks ahead.
Given this setup, traders should stay selective. The rise in the VIX and the failure to hold higher levels call for caution near the top of the range. Any new buying should focus on strong individual stocks rather than broad market bets.
Protecting profits, using tight stops, and avoiding big directional wagers until the index clearly moves above 23,800 will likely be the safest path. The week ahead should reward careful positioning over aggressive exposure.
Sector Outlook for the Next Week
We used Relative Rotation Graphs (RRG) to compare each sector with the CNX500 (Nifty 500) index, which covers about 95% of the market’s free‑float value.
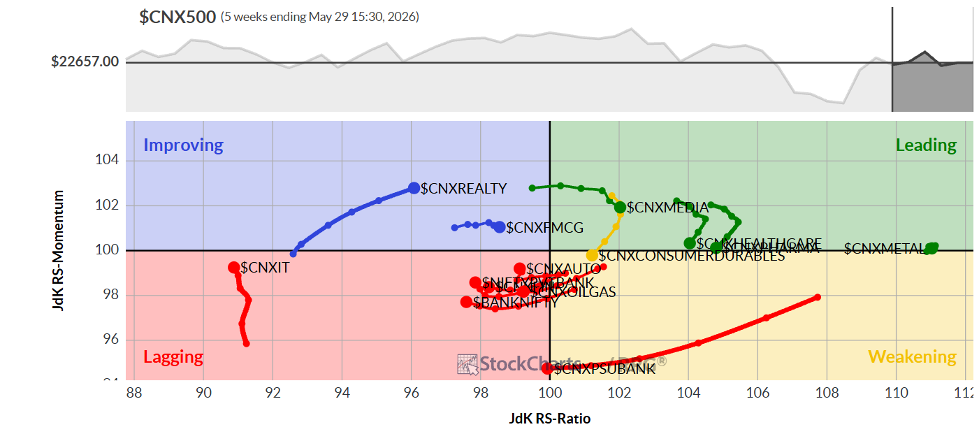
The RRG shows that Mid‑Cap, Energy, Media, Pharma and Metal sectors sit in the leading quadrant, meaning they are likely to beat the broader market. Pharma and Energy are slowing a bit, but they still have an edge.
Infrastructure and Public‑Sector Enterprise (PSE) indices are in the weakening quadrant, suggesting they may lose momentum relative to the market.
The PSU Bank, Bank, Services, Financial Services, Auto and IT indices are in the lagging quadrant, indicating they could underperform. The IT sector, however, is showing a quick improvement in its relative strength.
Fast‑Moving Consumer Goods (FMCG) and Realty are in the improving quadrant, so they may start to outperform the benchmark.
Note: RRG charts display relative strength and momentum. They are useful for spotting trends but are not direct buy or sell signals.
Source: Materials provided by https://articles.stockcharts.com.Note: Content may be edited for style and length.