

The market moved inside a tight band this week. Prices stayed close together, showing a gentle upward tilt. By Friday the index closed a bit higher.
Volatility rose a little. The India VIX fell 6.35% to 18.46, meaning traders bought fewer protection contracts. The Nifty added 99.60 points, up 0.42%.
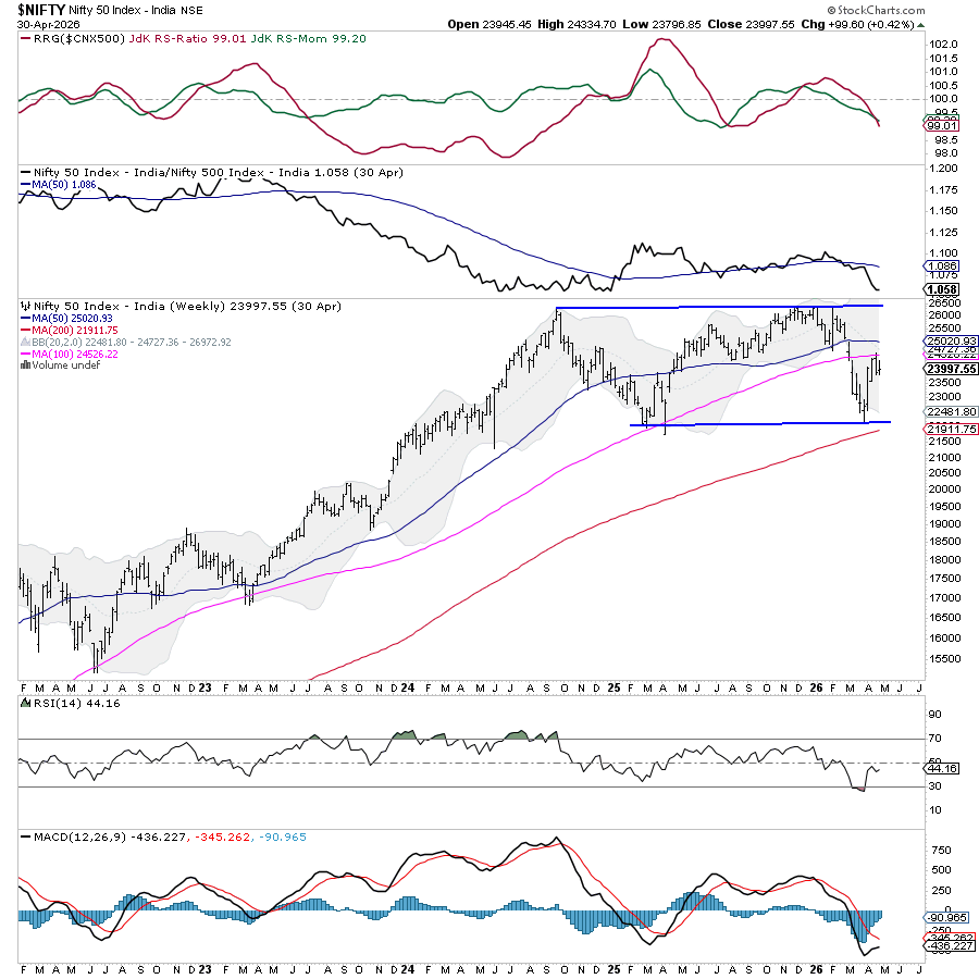
Technically, the Nifty is still in a wide consolidation zone. It sits near the lower half of its medium‑term range. A key level sits between 23,900 and 24,000, acting like a balance point.
If the price breaks above the top of the recent range, momentum could return. A break below the recent lows would bring more selling pressure. Until then, the index will likely stay in a sideways pattern with occasional spikes.
Next week may start steady but cautious. Resistance is around 24,350 and 24,550. Support sits near 23,900 and 23,500. These zones should shape daily moves.
The weekly RSI reads 44.16, a neutral value with no clear over‑bought or over‑sold signal. The MACD stays below its signal line, and the histogram is still negative, showing weak overall momentum, though the decline is easing.
A small candle with a lower shadow suggests buying interest at lower prices, hinting at possible stabilization.
The chart shows a large rectangle between 22,400 and 25,000. The 100‑week moving average acts as resistance. Because the price cannot stay above it, upside is limited for now, but the long‑term trend stays above the 200‑week average.
Given this picture, it is wiser to be selective. Big directional bets are risky unless a clear breakout occurs. Focus on individual stocks and keep risk tight. Protect existing profits and avoid heavy leverage. Approach the week with a balanced, reactive plan rather than trying to predict moves.
Sector Outlook for the Next Week
Using Relative Rotation Graphs, we compared many sectors to the NIFTY 500, which covers over 95 % of market value.
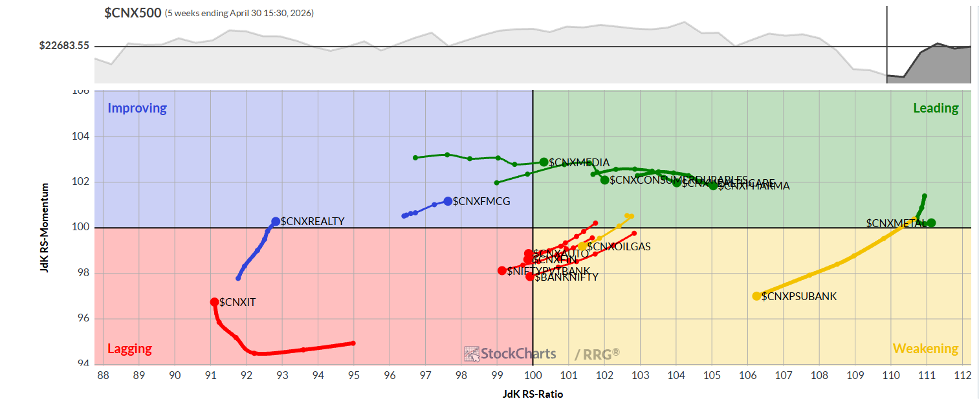
The Media sector moved into the leading quadrant, showing strength. Pharma, Public Sector Enterprises, Metals, Infrastructure, Mid‑Cap 100, and Energy also sit in the leading area, meaning they may beat the broader market.
The PSU Bank sector stays in the weakening quadrant, suggesting slower performance.
Bank, Auto, and Financial Services sectors are also in the weakening zone, along with Services. These groups may lag the market. The IT sector sits in the lagging quadrant but shows signs of improving momentum.
Realty and FMCG sectors appear in the improving quadrant, indicating potential relative gains.
Note: Relative Rotation Graphs display the relative strength and momentum of groups of stocks. They compare each sector to the NIFTY 500 and are not direct buy or sell signals.
Source: Materials provided by https://articles.stockcharts.com.Note: Content may be edited for style and length.