
May May Bring Stock Market Gains
Last week the market showed a lot of energy. The Nasdaq Composite broke the 25,000 mark for the first time. The S&P 500 and the S&P 600 Small‑Cap also closed at new highs.
Big tech companies helped push the market higher. They posted solid earnings, showing that large businesses are still spending and investing. This lifted the whole Technology sector. Semiconductor makers kept rising, and software stocks are starting to pick up speed.
What Does Seasonality Tell Us?
Even with the market feeling bullish, many investors wonder if May is a good month to stay invested. A seasonality chart looks at how an index performed in the same month over many years.
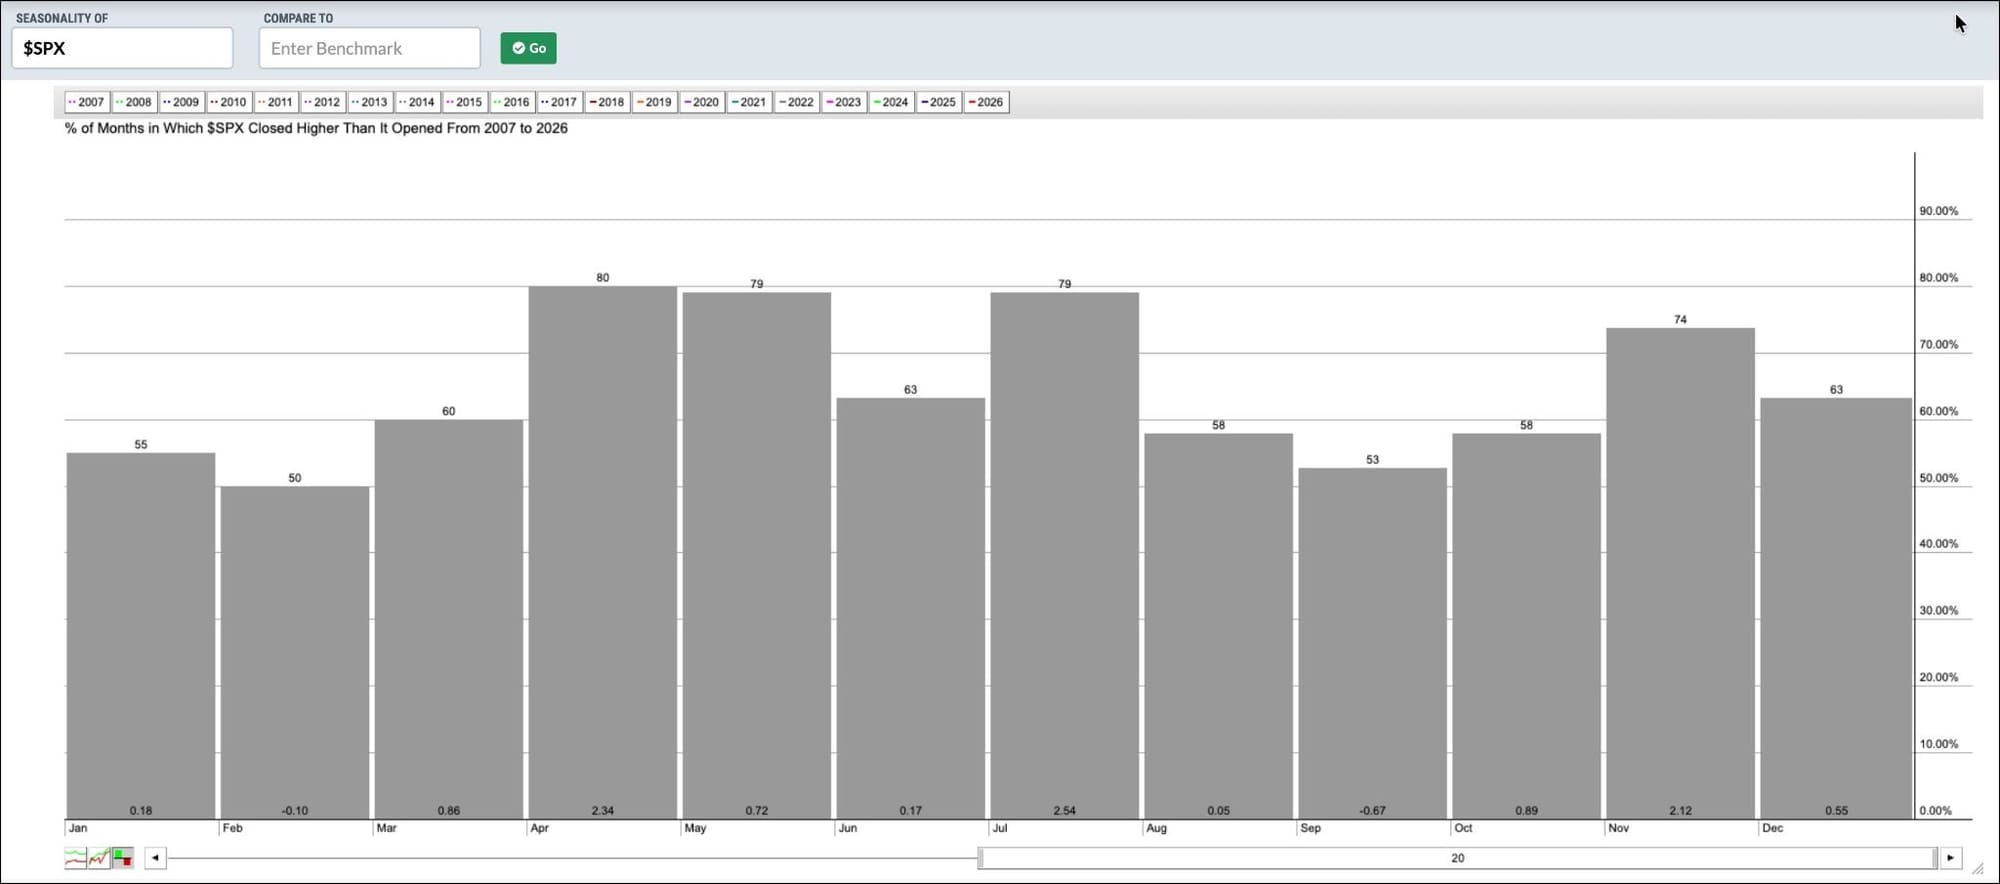
When you examine the S&P 500 over the last 20 years, May was positive about 79% of the time, with an average gain of 0.72%. That looks modest, but the picture changes when you shorten the look‑back period. If you look at the last 10 years, the average May return is noticeably higher. Zooming in to the last five years shows an even stronger upside.
Quick tip: Click the chart and set a five‑year view to see the recent trend.
How to Use the Tool
You can type any ticker, such as $COMPQ for the Nasdaq, $NDX for the Nasdaq‑100, or even a sector ETF like XLK. By comparing the ETF’s seasonality to the benchmark, you can see what percentage of months the ETF outperformed the index.
These charts are useful for spotting sectors, stocks, or ETFs that have historically done well in certain months. Remember, they are based on past data and probabilities, not guarantees.
What’s Coming Up?
Next week brings another round of earnings reports. Companies like Palantir, AMD, Disney, Arm Holdings, and Pfizer are on the calendar. If their results stay strong, the market could keep climbing.
But it’s wise to stay alert. The market looks a bit stretched, and any escalation in global conflicts could quickly change investor sentiment.
Watch the Oil Market
Crude‑oil prices often influence the broader market. Keep an eye on oil charts early in the week to gauge potential impacts.
Enjoy your weekend and stay informed!
Source: Materials provided by https://articles.stockcharts.com.Note: Content may be edited for style and length.