
Nifty Under Pressure This Week
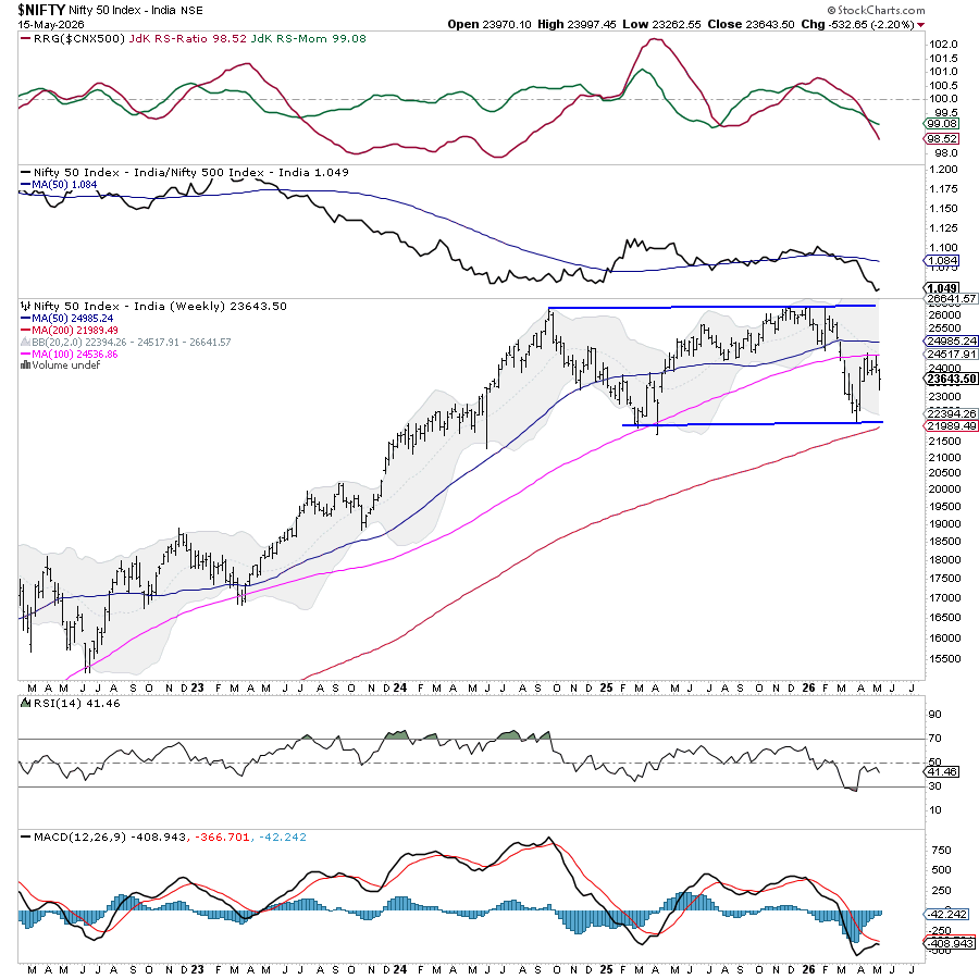
The Indian market stayed weak throughout the week. Sellers stayed in control and the Nifty moved inside a wide 734‑point band, reaching a high of 23,997.45 and a low of 23,262.55. The headline index closed down 532.65 points, or about 2.2%.

Fear among investors grew, pushing the India VIX up 11.6% to 18.79. Higher VIX means more nervousness and a bigger chance of rapid price moves.
Technically, the Nifty is still fragile. It could not hold above the 24,500‑24,700 area, which lines up with the 100‑week moving average and the middle Bollinger Band.
The index also fell back under the 50‑week average near 24,985, keeping the medium‑term trend weak. The price pattern now looks like a broad consolidation that is starting to correct, with lower highs forming on each bounce.
Support near 23,200‑23,000 is important. A clear break below this range could start a fresh drop. To turn the picture around, the market would need a firm move above 24,300‑24,500.
What to Watch Next Week
Volatility is likely to stay high. Key resistance levels are around 23,850 and 24,000. Important support levels sit at 23,350 and 23,150.
The weekly RSI reads 41.5, staying below the neutral 50 line, which signals weakening momentum. There is no strong bullish or bearish divergence. The weekly MACD is also below its signal line, confirming a weak trend.
The candle on the chart looks like a bearish continuation pattern, reinforcing the current corrective bias.
On the longer side, the 100‑week average at 24,538 now acts as a ceiling, while the 200‑week average near 21,990 still offers deep support. Bollinger Bands are widening again, hinting that price swings could become larger.
Trading Advice
Given the fragile setup, traders should be very careful. Avoid big new buys until the index shows steady strength above the near‑term resistance zone. Protecting capital and using strict stop‑losses are essential as volatility stays high.
Look for opportunities in individual stocks rather than broad market bets. Keep leverage low and stay defensive.
Sector Snapshot for the Week Ahead
We compared several sectors to the Nifty 500, which represents most of the market’s value.
Energy, Mid‑Cap 100, Media, Pharma and Public‑Sector Enterprises sit in the “leading” zone, meaning they could beat the market even if a few are losing momentum.
Metals and Infrastructure have moved into the “weakening” zone, suggesting slower relative performance. PSU banks are also in this area.
Auto, Financial Services, Services, and Bank indices are in the “lagging” zone and may underperform. The IT index is also lagging but shows signs of improving momentum.
Realty and FMCG are placed in the “improving” zone, indicating they might start to perform better relative to the market.
Remember, these charts only show relative strength and momentum. They are not direct buy or sell signals.
Source: Materials provided by https://articles.stockcharts.com.Note: Content may be edited for style and length.