

A few weeks ago I noticed the gold‑to‑bond ratio looking tired. When that ratio turns down, it often means a good chance to buy bonds. I thought any bounce would be small because it would be a short‑term move.
So far, nothing has flipped that signal. Instead, other clues now point to bond yields breaking out of their multi‑year range. The last two weeks of May could decide where the market heads.
How Inflation Drives Bond Yields
Inflation is the main force that moves interest rates. When prices rise, the fixed payments from bonds lose buying power. Investors then demand higher yields, which push bond prices down. The stronger and longer inflation lasts, the more yields climb.
Chart 1 compares the 18‑month rate of change in the Consumer Price Index (CPI) with the 30‑year Treasury yield. The CPI line is on the left axis. Looking back, the vertical lines show the low points in CPI momentum. When those lows line up with the yield, the yield usually goes up.
The red and green arrows show the long‑term trend. During a long‑term bull market for yields, strong CPI signals cause big jumps in yields. In the last 65 years, false signals only happened during long‑term bear markets.
Now the technical picture suggests a new long‑term bull market for yields. The rate‑of‑change line has bottomed, and the 30‑year yield is rising above its 48‑month average, backed by inflation data.
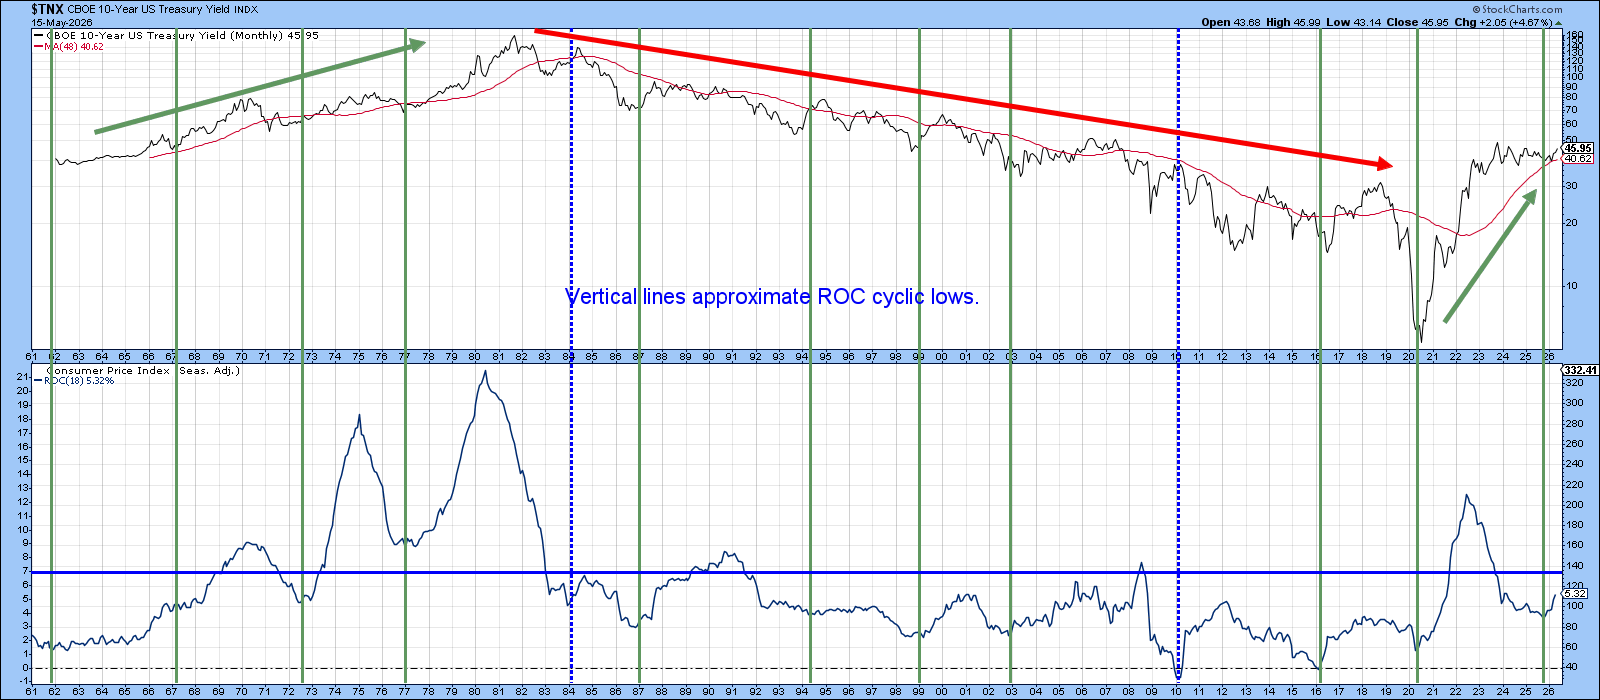
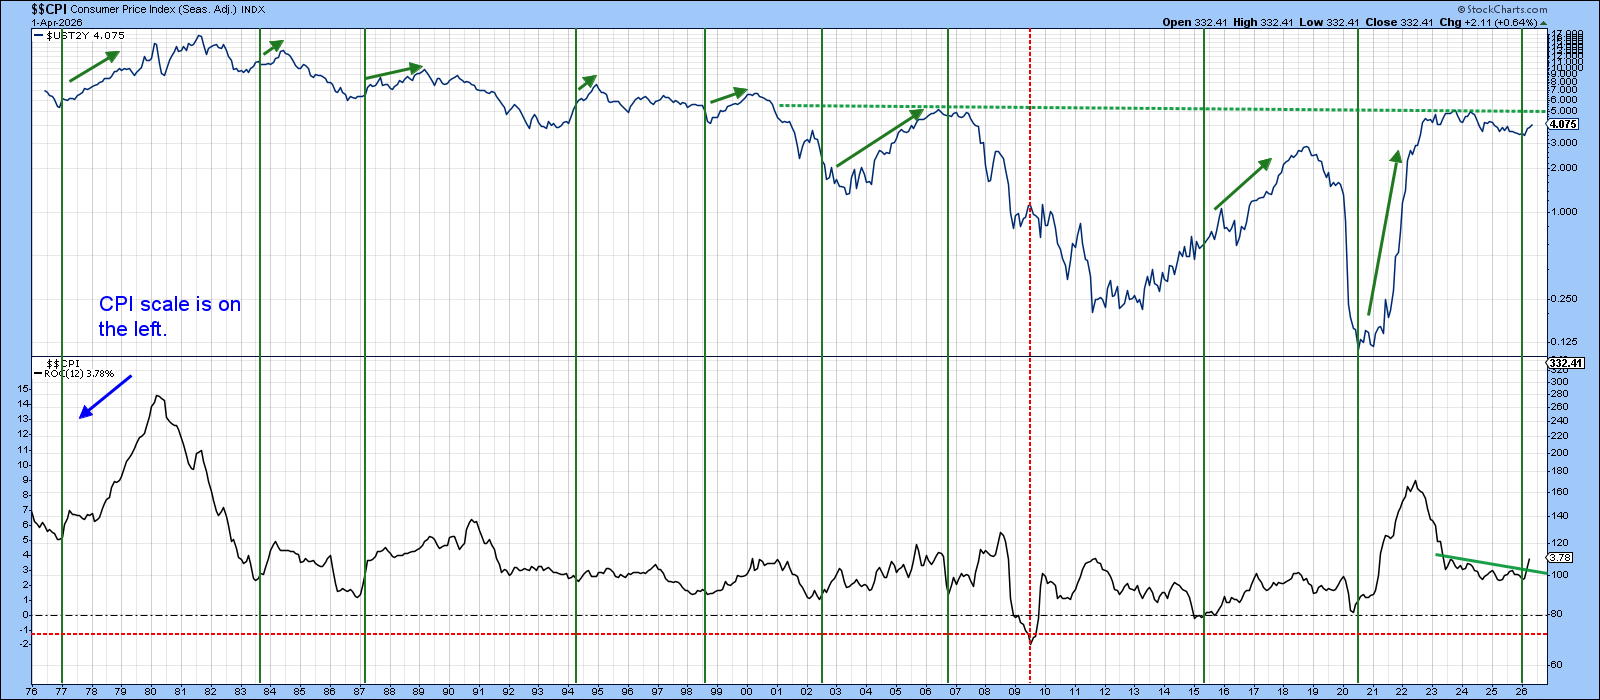
Chart 2 looks at the 2‑year Treasury yield against the 12‑month CPI change. The same low‑point lines are drawn. Recent CPI data broke out of its range, hinting that the cycle bottom is over.
We don’t know how far CPI momentum will go, but the 2‑year yield usually moves before the Fed’s policy rate. With CPI turning up and the 2‑year already rising, the next Fed move is more likely to be higher, not lower.
Rising Rates Around the World
Chart 3 widens the view to include other countries. The 10‑year yields for the U.K., Germany, and Japan have all hit new cycle highs and are now ahead of the U.S. 10‑year, which is fighting a three‑year resistance line. With global rates moving up, it’s hard to see the U.S. doing the opposite.
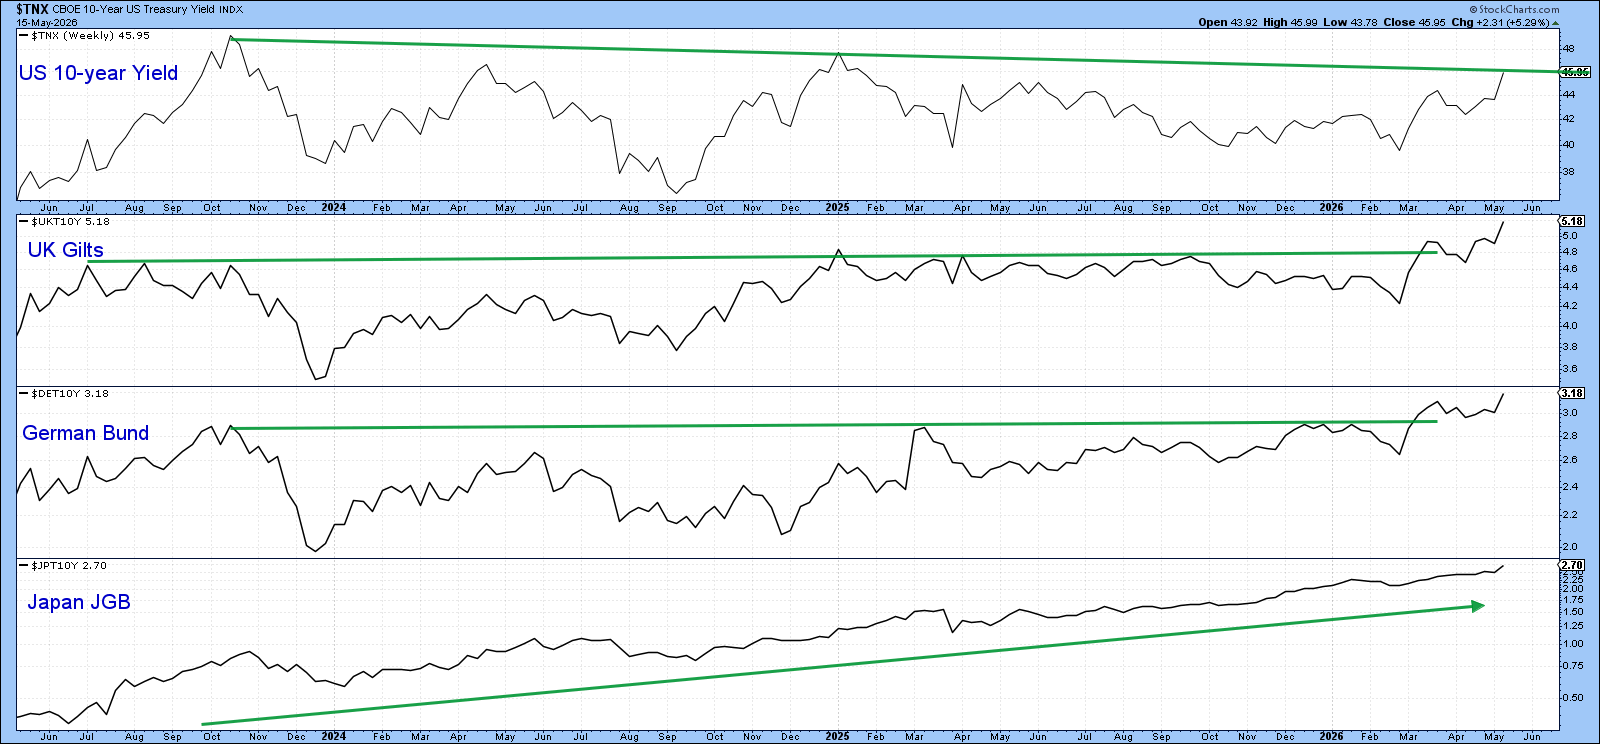
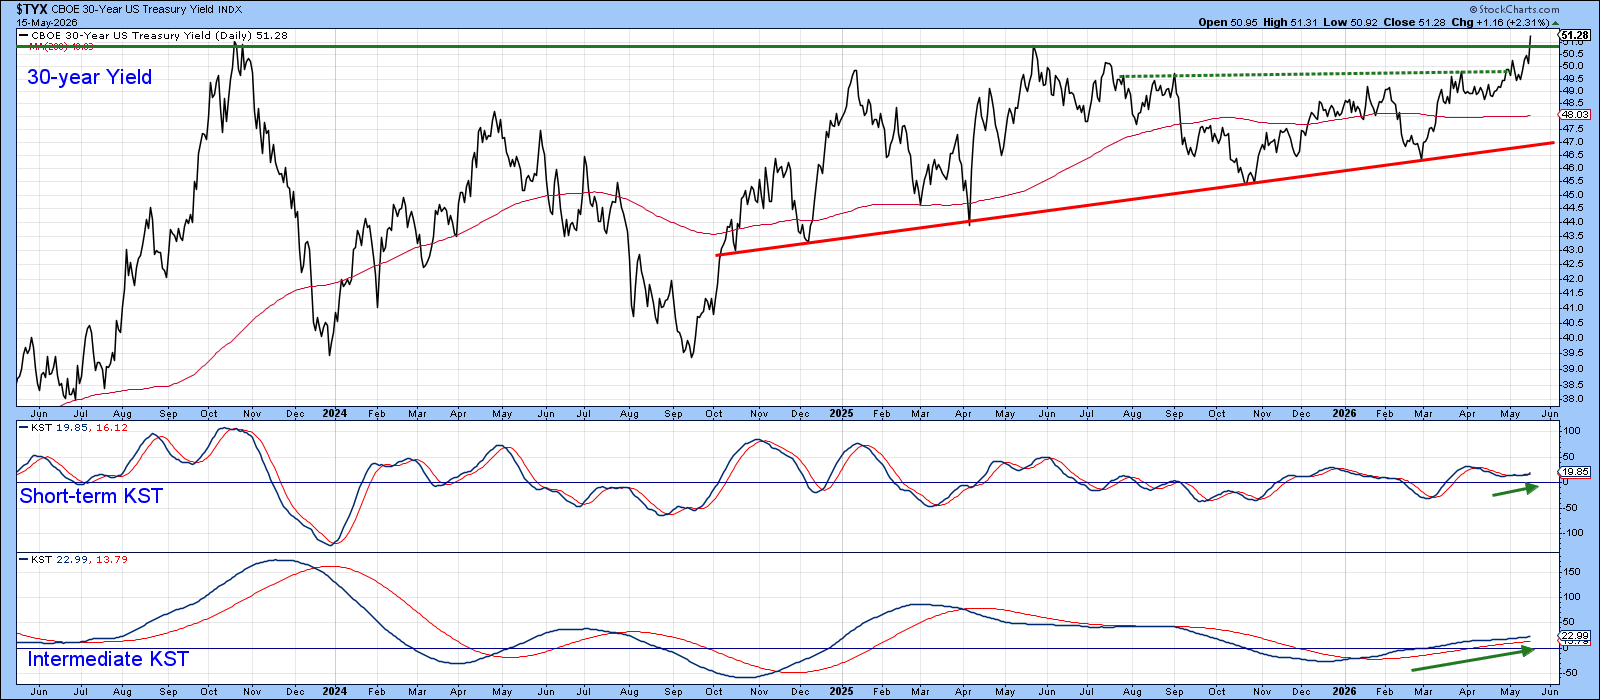
Chart 4 shows the 30‑year yield ending last Friday at a small new cycle high. The breakout must hold, so next week’s price action is crucial. The yield is already above a green trendline that marks the neck of an inverse head‑and‑shoulders pattern, and both momentum measures stay slightly positive. All signs point to a longer bull market for yields and a falling market for bond prices.
Stay curious and keep tracking the charts.
Source: Materials provided by https://articles.stockcharts.com.Note: Content may be edited for style and length.