Key Market Move
The CAC 40 cash index finished higher, gaining 0.93% to 8,082.27 points with a volume of €2.934 billion.
Why the Market Went Up
On Thursday, May 14, France celebrated the Ascension holiday. The pause in trading helped the market stay calm. At the same time, good news from around the world lifted investor confidence.
In Beijing, leaders from the United States and China met for the first time in almost ten years. They talked about trade, technology and several global issues. The meeting was covered by many news agencies and created a hopeful atmosphere.
U.S. President Donald Trump arrived in China with well‑known tech CEOs, including the heads of Nvidia and Tesla. The Chinese vice‑president welcomed the delegation with a formal ceremony. Their talks covered the Middle East, the war in Ukraine, and the Korean peninsula. The only point of disagreement was Taiwan.
Energy and U.S. Retail News
Crude oil stayed strong, with Brent oil trading above $100 per barrel, around $106. This supported risk‑on sentiment in equity markets.
U.S. retail sales for April rose by 0.5%, matching analysts’ expectations. The data came after higher‑than‑expected inflation numbers, which may lead the Federal Reserve to consider another rate hike.
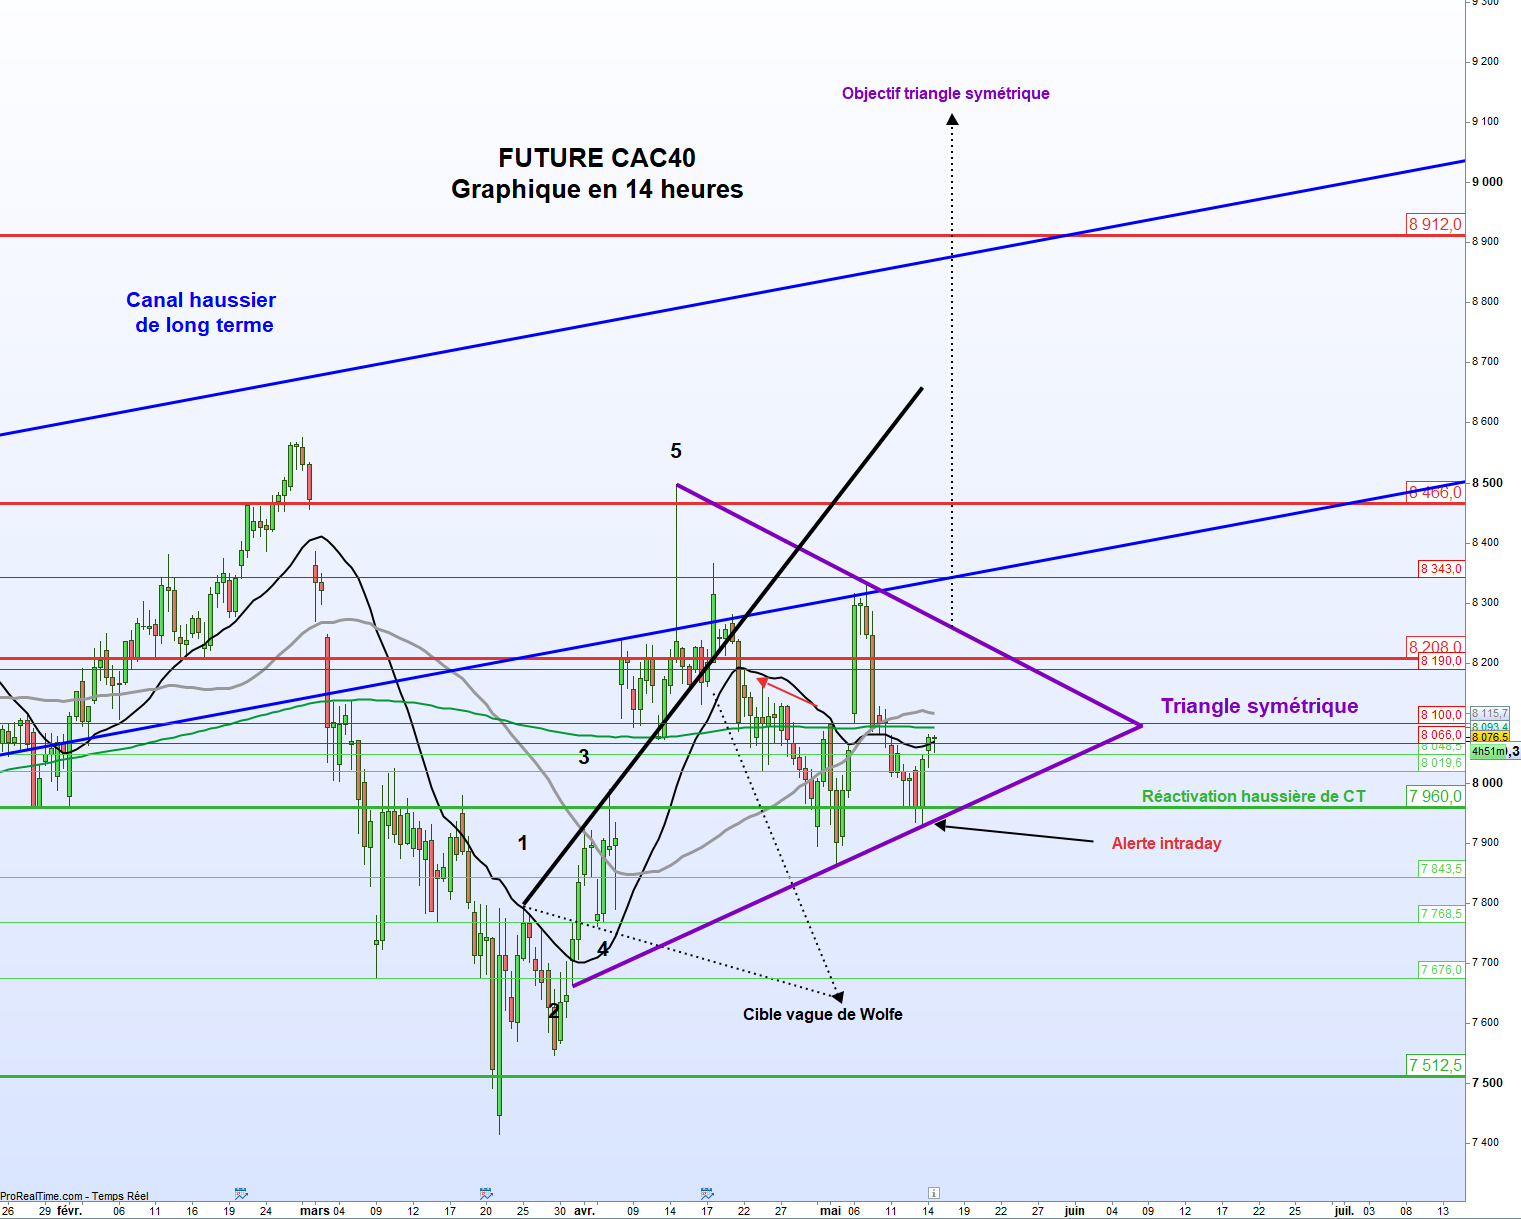
Future May Contract – Technical Outlook
Resistance levels: 8,066 | 8,090 | 8,100 | 8,190 | 8,208 | 8,240 | 8,343 | 8,466 | 8,912 | 8,434.
Support levels: 8,048 | 8,019 | 7,960 | 7,844 | 7,768 | 7,676 | 7,512 | 6,999 | 6,467.
During the day, the price stayed above 7,960, indicating a short‑term upward bias.
Technical charts show the index bouncing off the lower side of a symmetrical triangle that formed since late March. A bullish engulfing candle signaled a possible reversal.
If the price breaks the diagonal line near 8,100 points, the short‑term trend could turn strongly upward, aiming for the upper triangle edge around 8,270 points. A further break toward the long‑term upward channel at 8,343 points would suggest the consolidation phase is ending, with a next target near 9,100 points.
Conversely, a drop below the 7,960‑7,940 range would invalidate the triangle pattern. The price could then head toward the Wolfe wave target around 7,600 points and possibly slide to the intermediate support at 7,512.5 points. A break of that level might push the market toward the triple‑top neckline near 6,999 points.
Portfolio Impact
We have added the latest chart pattern to our Dynamic and Investor portfolios. The shape hints at a possible end to the current consolidation. We will keep a close eye on the alert levels. If any of them break, we will adjust risk exposure and use appropriate hedges.