


About a month ago we said JPMorgan could fall because new AI tools might hurt its business. We made a trade that earned 144%.
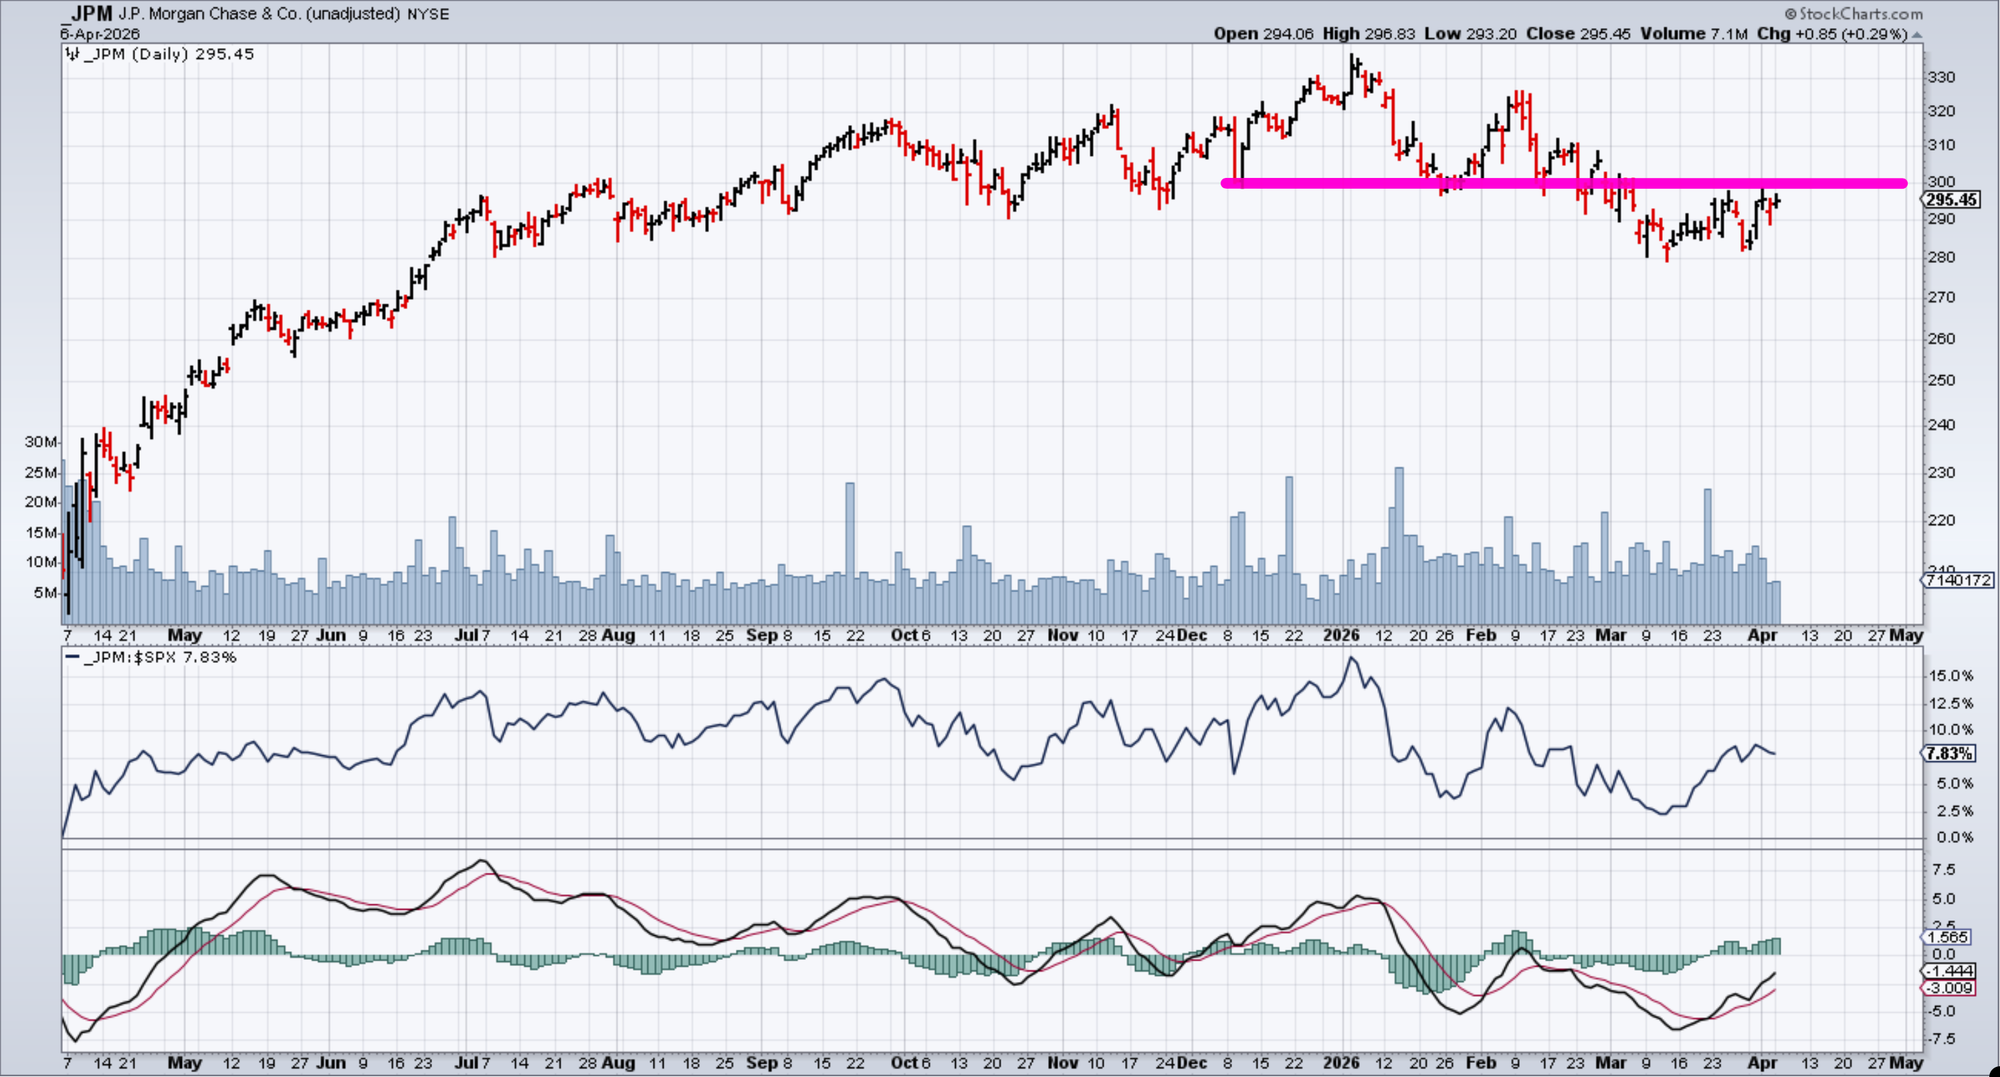
Now another chance appears. The stock is near $300, a level that now acts as resistance. If it can’t break above, the price may drop again.
Why the Stock Might Fall
Two big risks are building.
- Private‑credit markets are getting stressed. Problems there could spread to big banks.
- Consumer loans are under pressure. A possible 10% cap on credit could cut profits, especially as delinquency rates rise.
JPMorgan’s earnings report is set for April 14. That event could trigger a sharp price move.
What the Chart Shows
The chart shows a classic “re‑test and reject” pattern. Last month the price fell below $300, rose a little, then fell back to test the same level from below. Now it is being rejected again, suggesting another move lower.
Simple Trade Idea
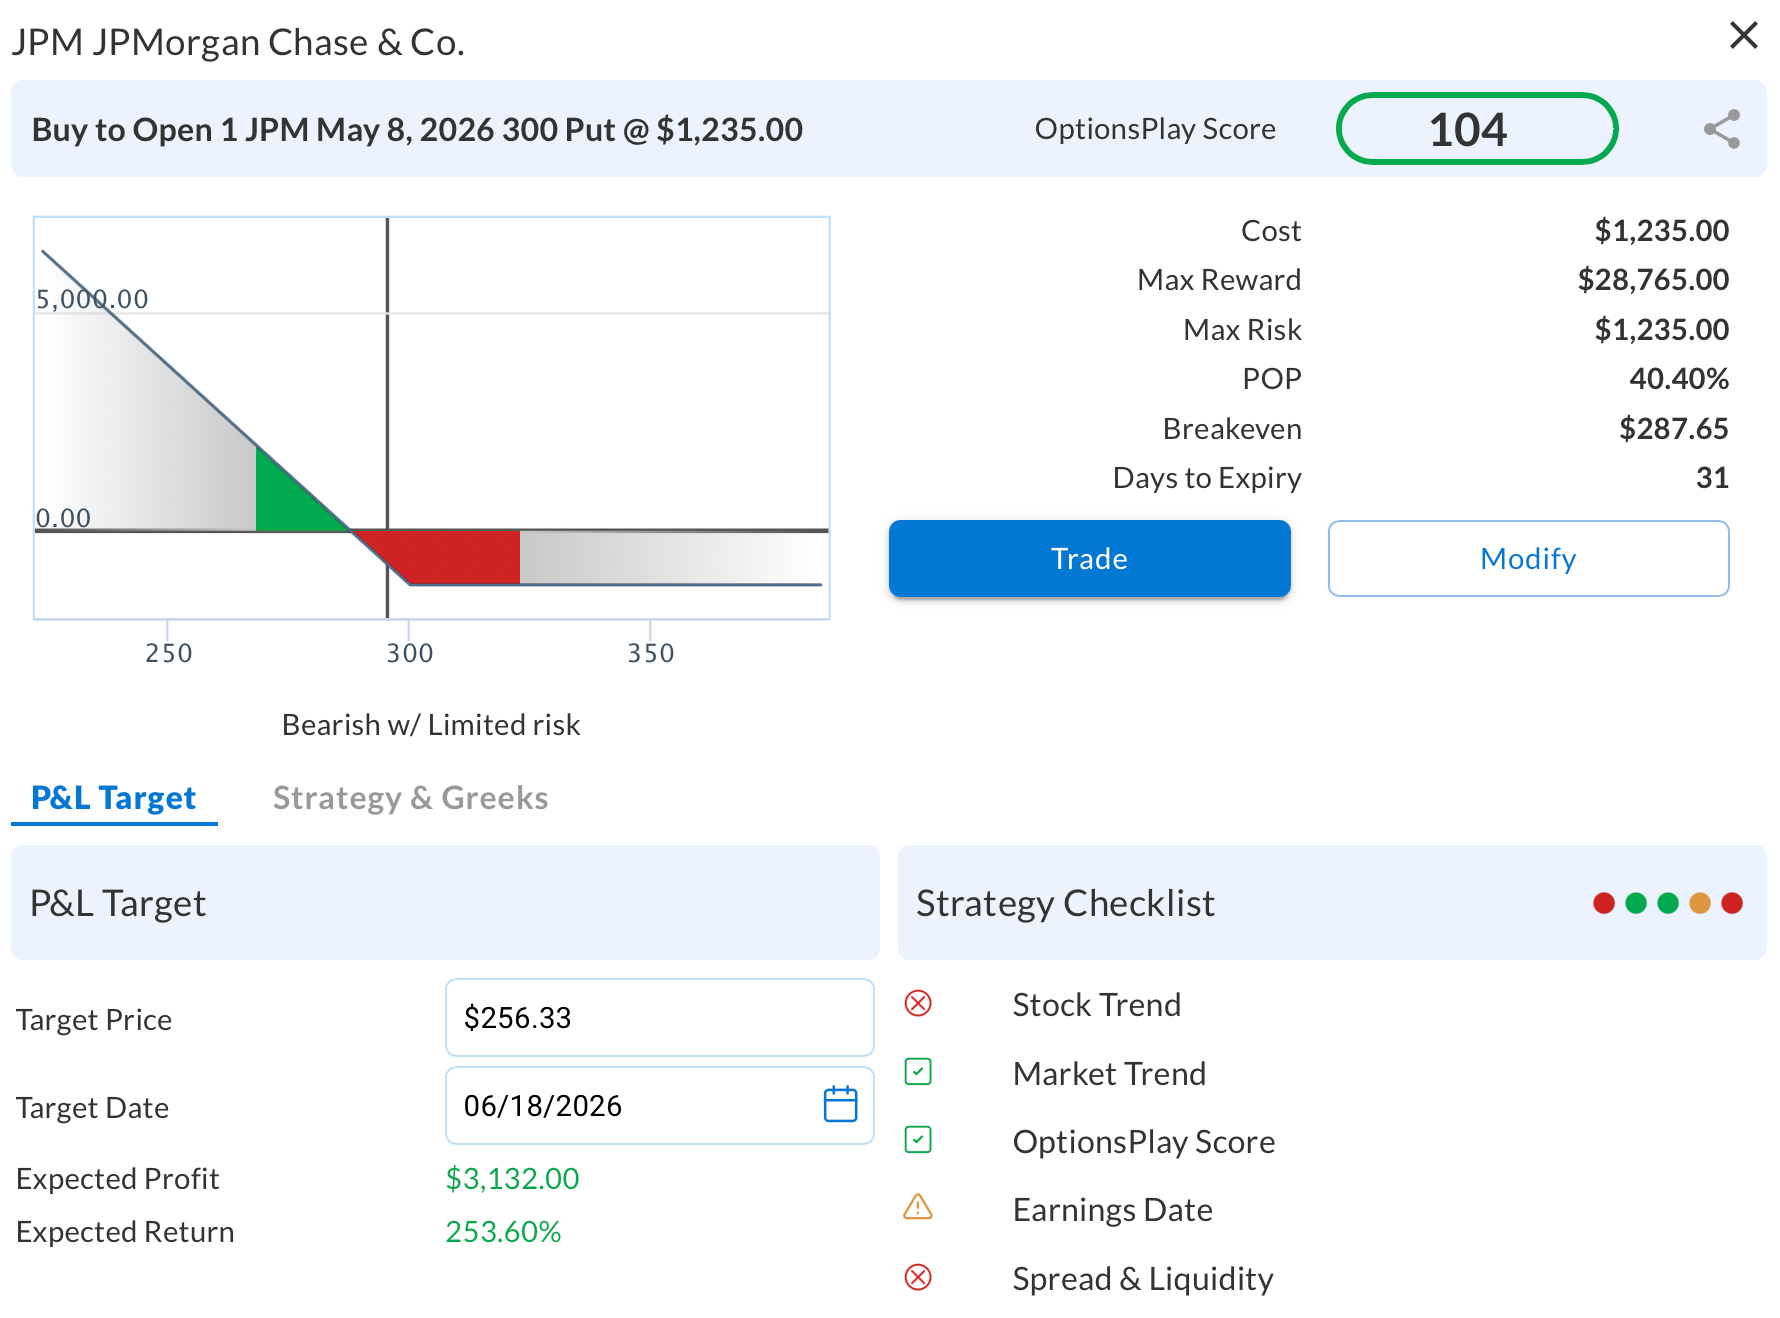
To profit from a drop, we can buy a long put.
- Strategy: Long Put
- Expiration: May 8, 2026 (31 days)
- Strike: $300
- Cost: about $12.30 per contract
- Breakeven: $287.70 (just 2.6% below current price)
Why This Trade Makes Sense
- Clear risk: If the stock closes above $300, we exit.
- Unlimited upside: The lower the price, the more profit.
- Small move needed: A 2.6% drop breaks even.
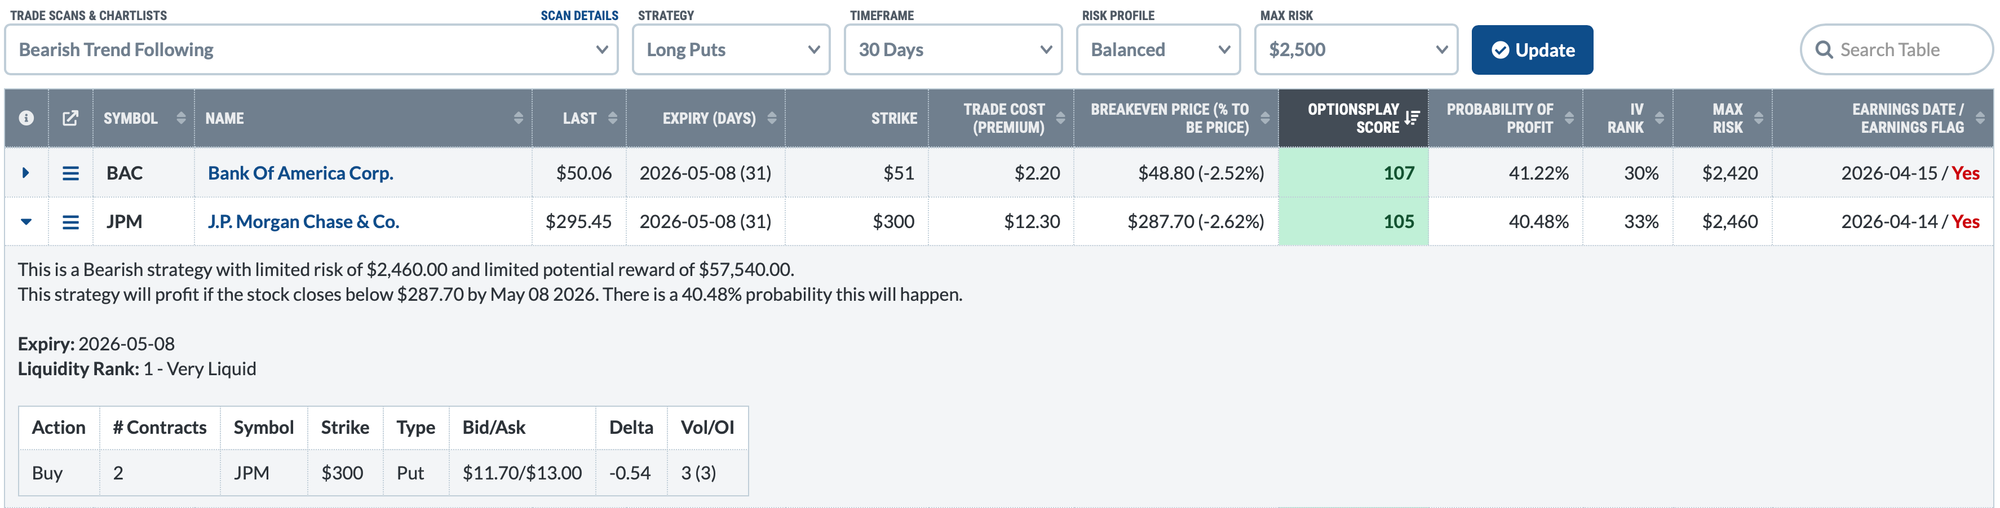
Finding Similar Trades Fast
Instead of scanning many stocks, checking fundamentals, and building spreads, a tool can locate setups in seconds. It looks for stocks with strong technical patterns, liquid options, and good strike choices.
Using this method, JPMorgan appeared at the top of the list with a score of 105.
Bottom Line
We already earned 144% from a previous short trade. The stock is now testing $300 again, right before earnings and regulatory concerns. Buying a $300 put that expires in early May gives a quick way to catch the next move down.
Source: Materials provided by https://articles.stockcharts.com.Note: Content may be edited for style and length.