
After a week when the S&P 500 rose roughly three percent, the list of leading sectors stayed almost the same.
The top five sectors kept their spots. At the bottom, Financials moved up one place, while Consumer Discretionary slipped down.
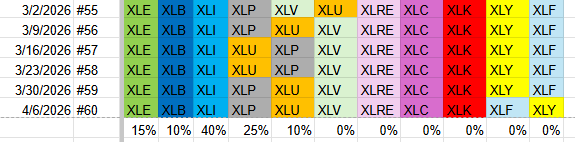
Current Sector Ranking
- Energy – XLE (15%)
- Materials – XLB (10%)
- Industrials – XLI (40%)
- Consumer Staples – XLP (25%)
- Utilities – XLU (10%)
- Health Care – XLV
- Real Estate – XLRE
- Communication Services – XLC
- Technology – XLK
- Financials – XLF
- Consumer Discretionary – XLY
Weekly Relative Rotation Graph (RRG)
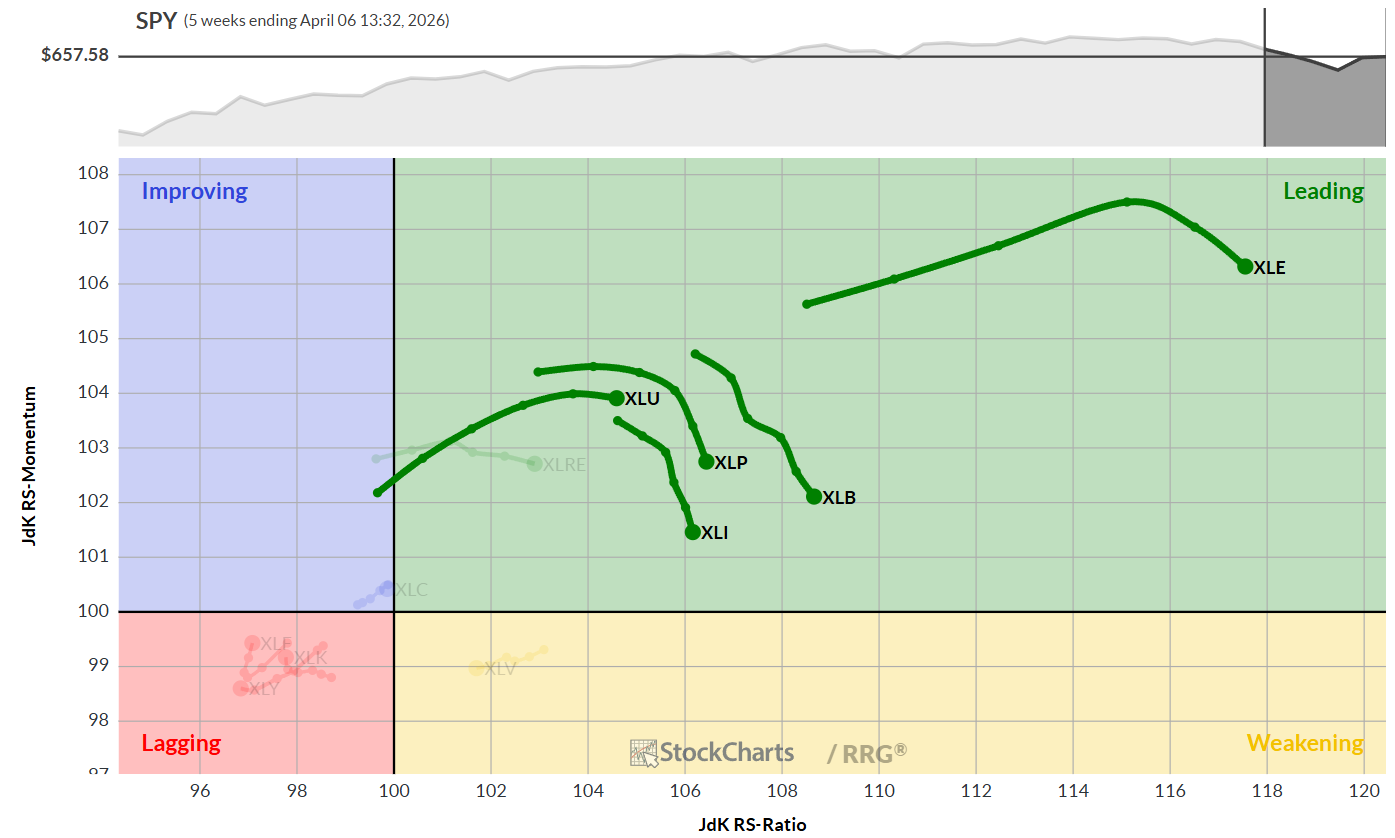
The weekly RRG shows all five leading sectors staying in the “leading” quadrant. They are still moving higher on the RS‑ratio scale, but the speed of their outperformance is slowing a little.
Daily Relative Rotation Graph (RRG)
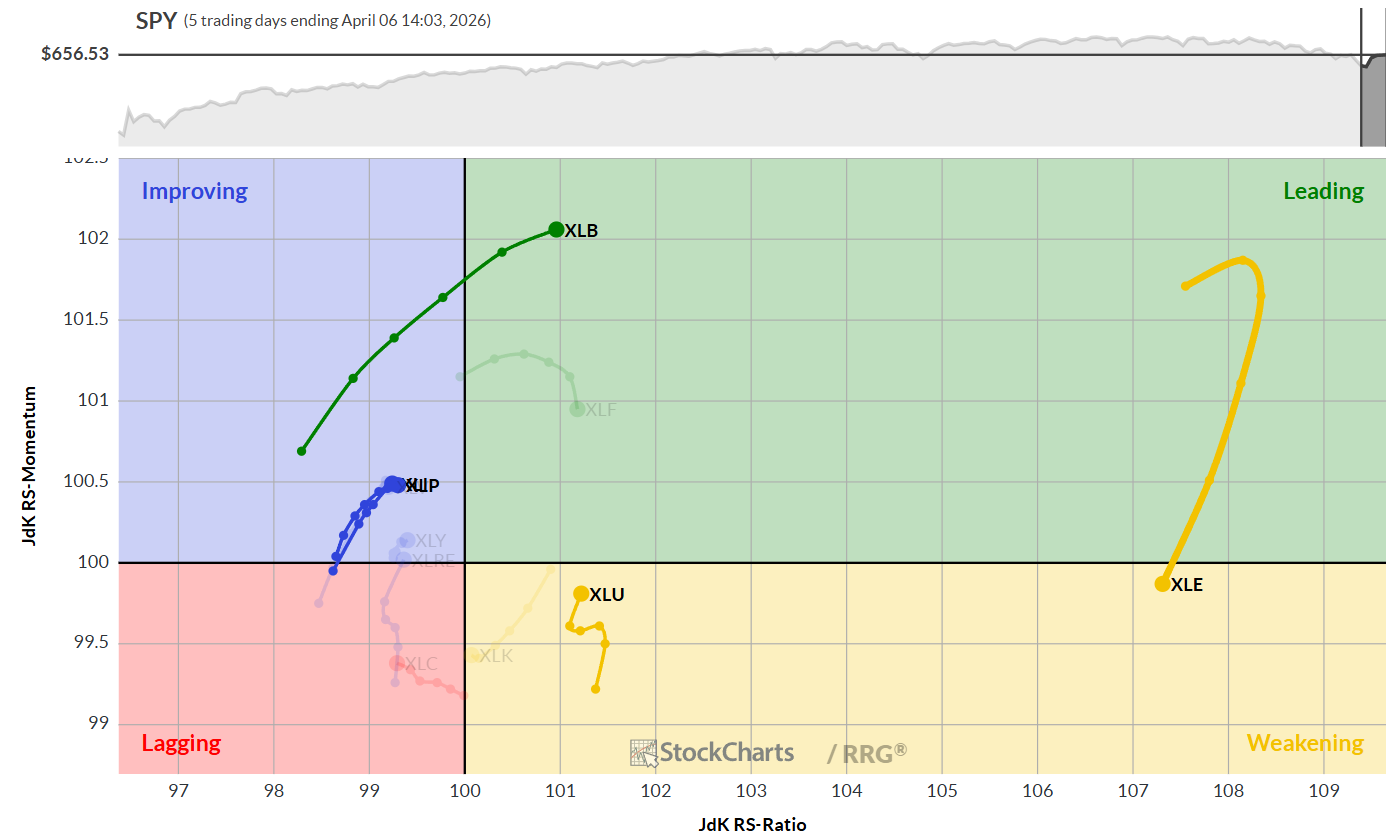
On the daily chart, Energy still has the highest RS‑ratio, but it is beginning to turn toward the weakening area, hinting at a short pause.
The other four top sectors—Materials, Industrials, Consumer Staples, and Utilities—are all moving upward on both RS‑ratio and RS‑momentum, which is a good sign for continued strength.
Sector Highlights
Energy
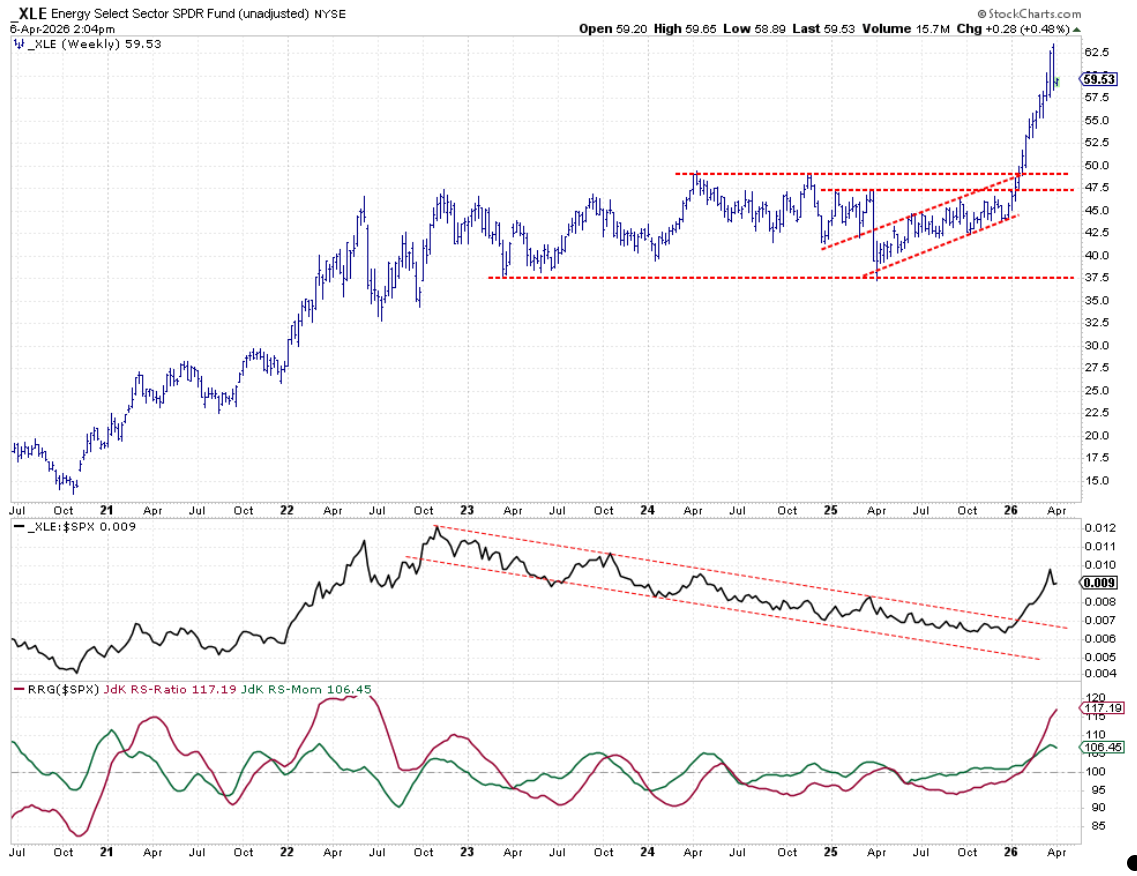
Energy kept climbing higher each week. The relative‑strength line confirms a breakout, even though a small dip shows a brief pause in momentum.
Materials
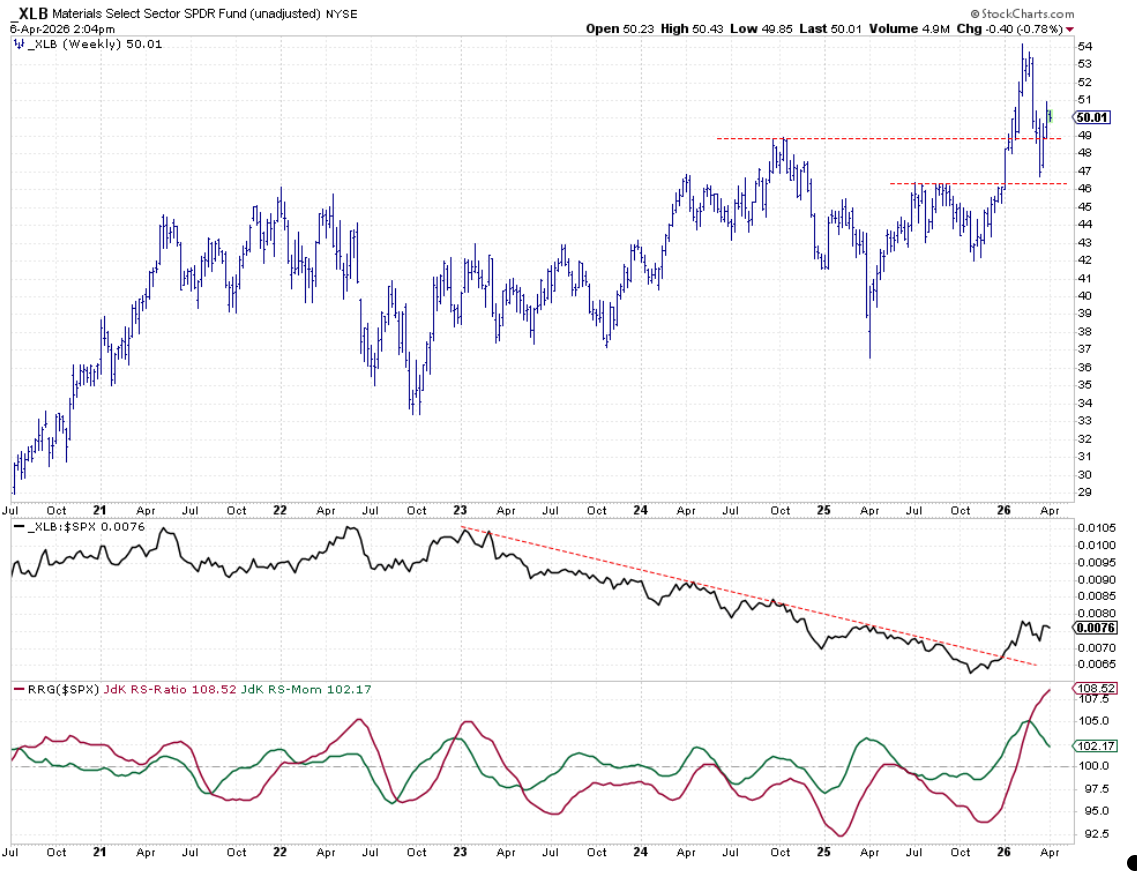
Materials fell to about 46, found support, and then rose back above 50. The RS‑ratio stays high, giving the sector room to correct without breaking its uptrend.
Industrials
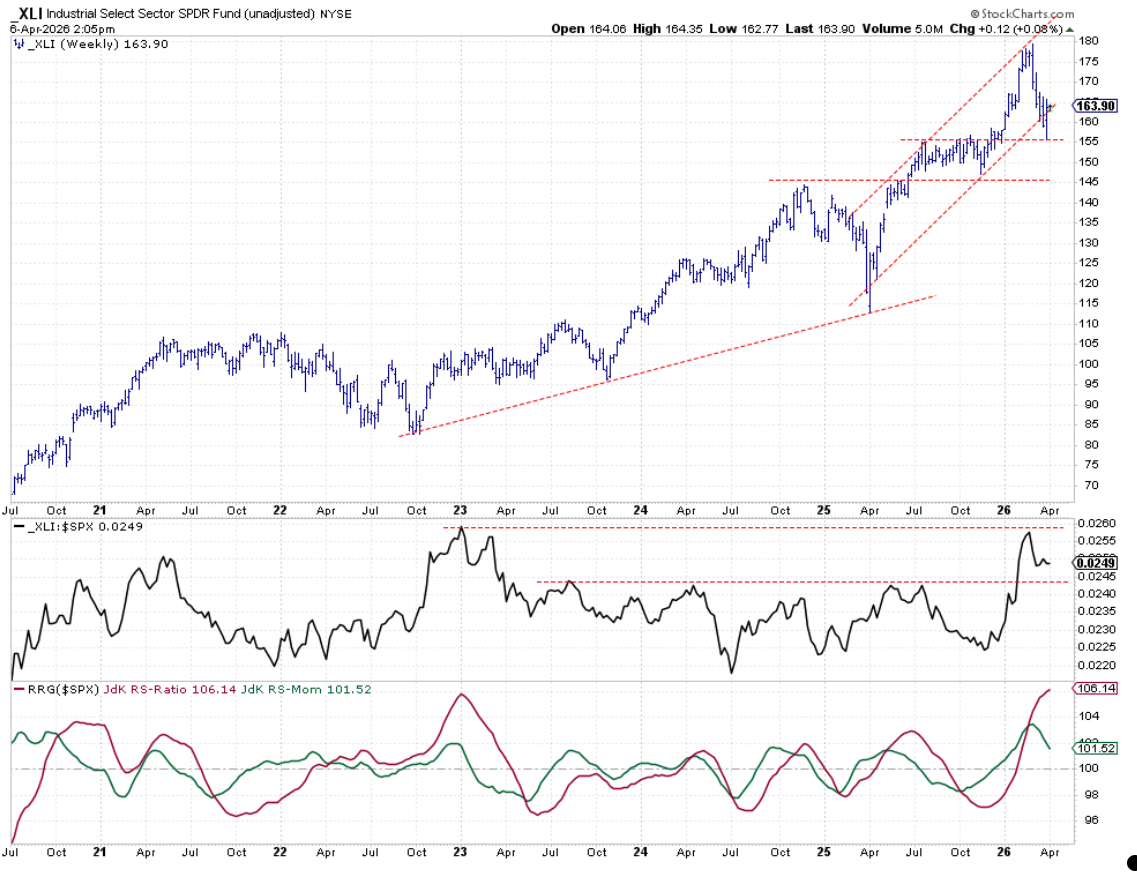
Industrials bounced off resistance near $155 and are moving higher within a clear channel. The RS‑ratio remains strong, suggesting any pull‑back will be temporary.
Consumer Staples
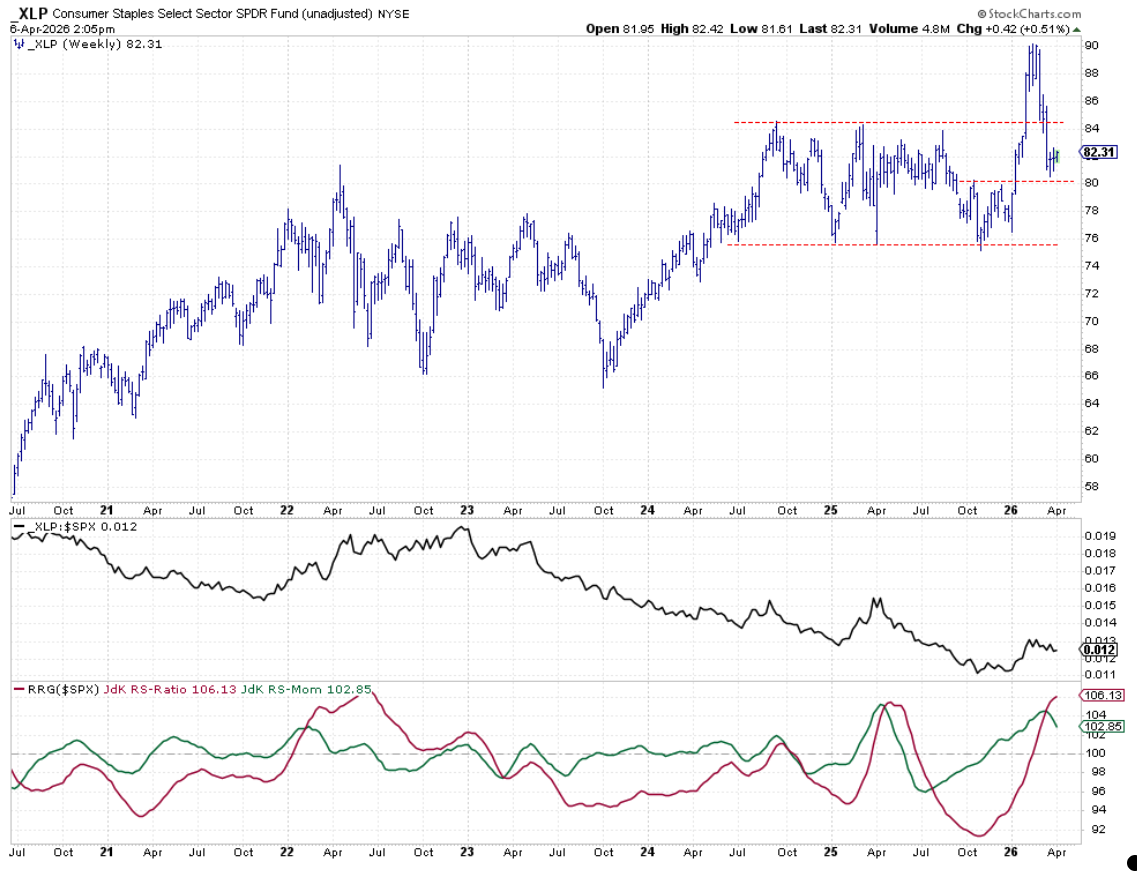
Staples dropped to around 80 before finding a firm floor. As long as that level holds, the outlook stays positive. A breakout above the recent high would push the sector further into the leading quadrant.
Utilities
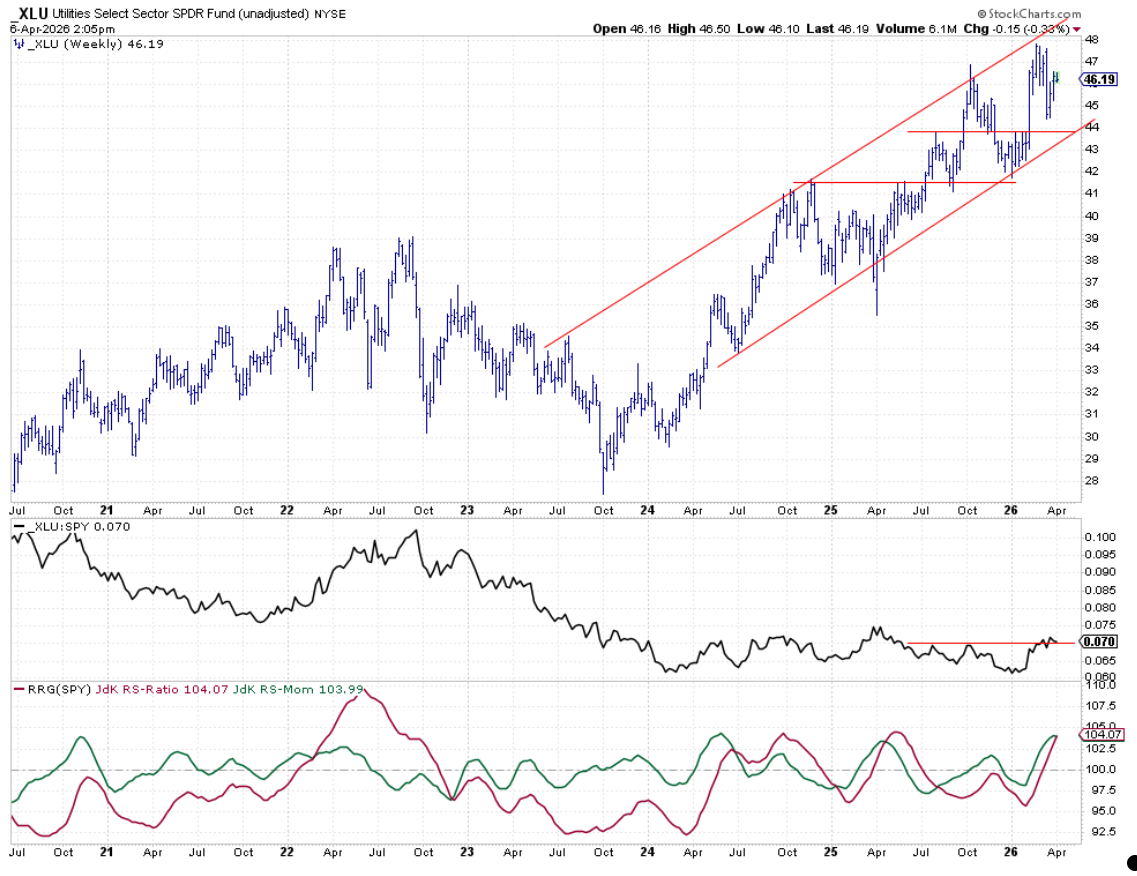
Utilities continue to make higher highs and higher lows within a rising channel. Momentum is easing, but the sector still has enough strength for another upward move.
Portfolio Perspective
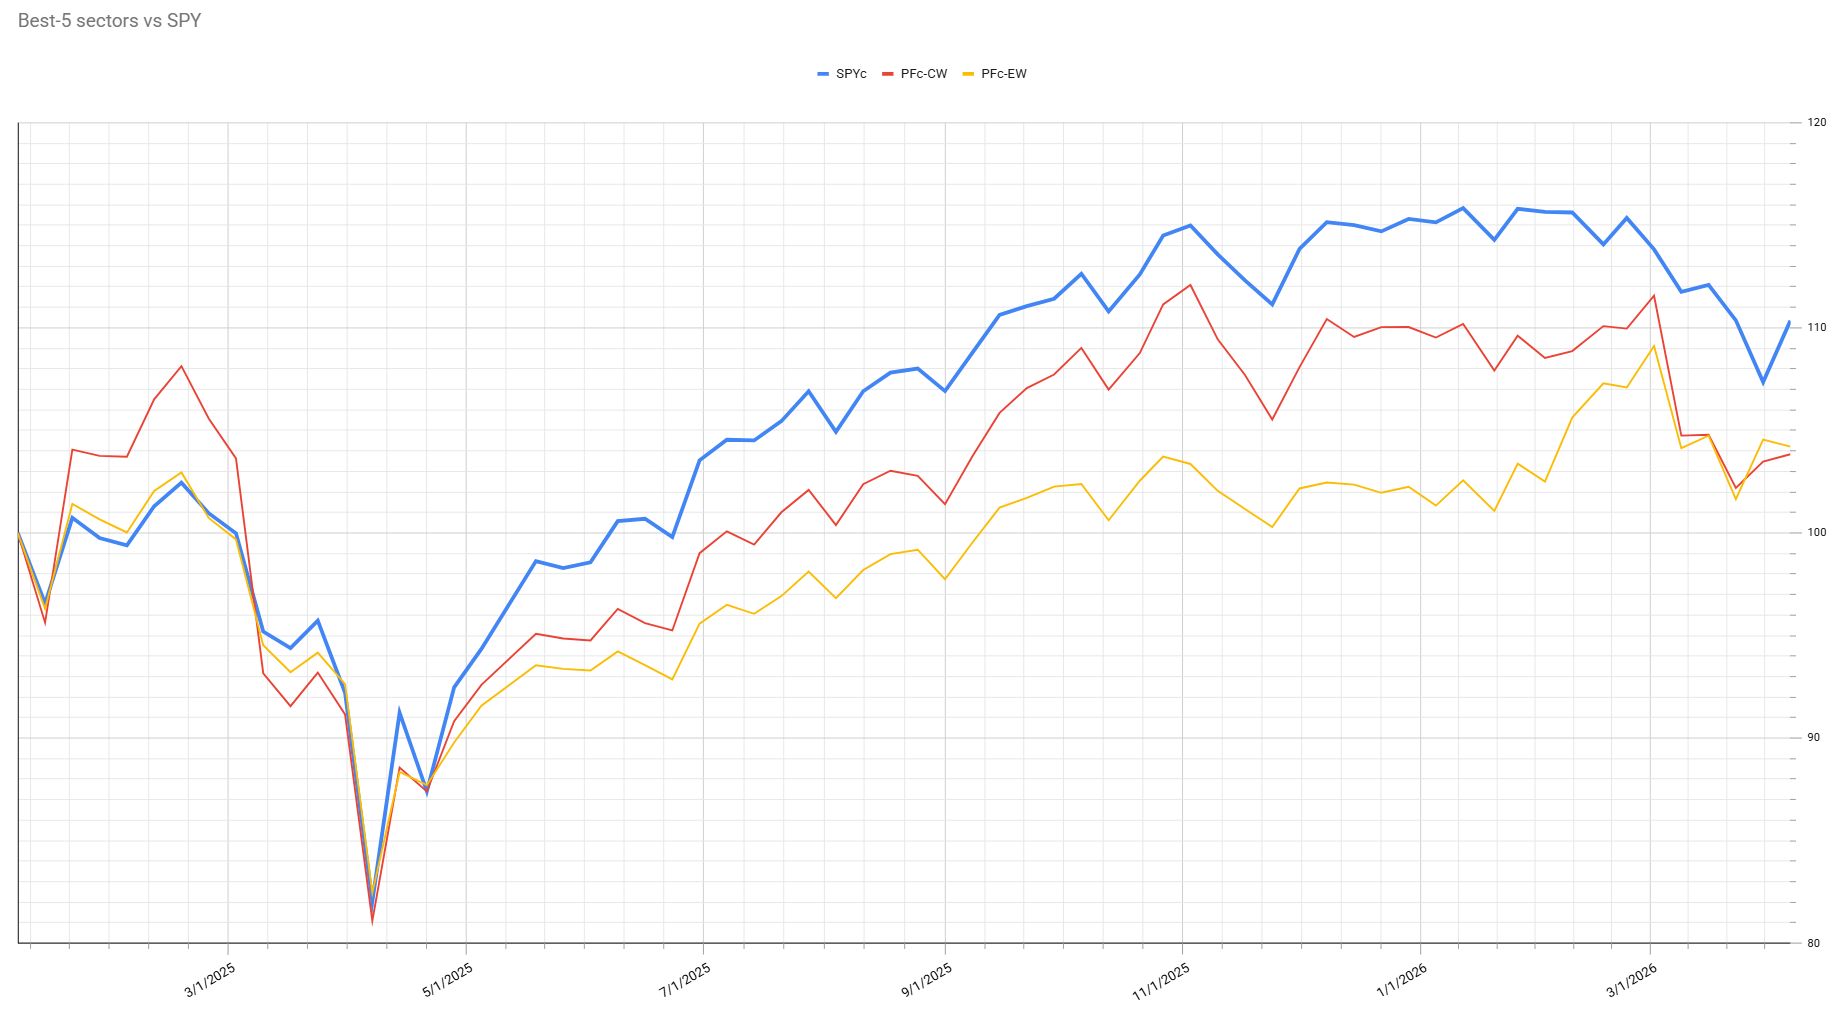
The S&P 500’s strong week made defensive portfolios lag behind by about five to six percent. However, because the top five sectors are defensive, these portfolios could do well when the market turns lower.
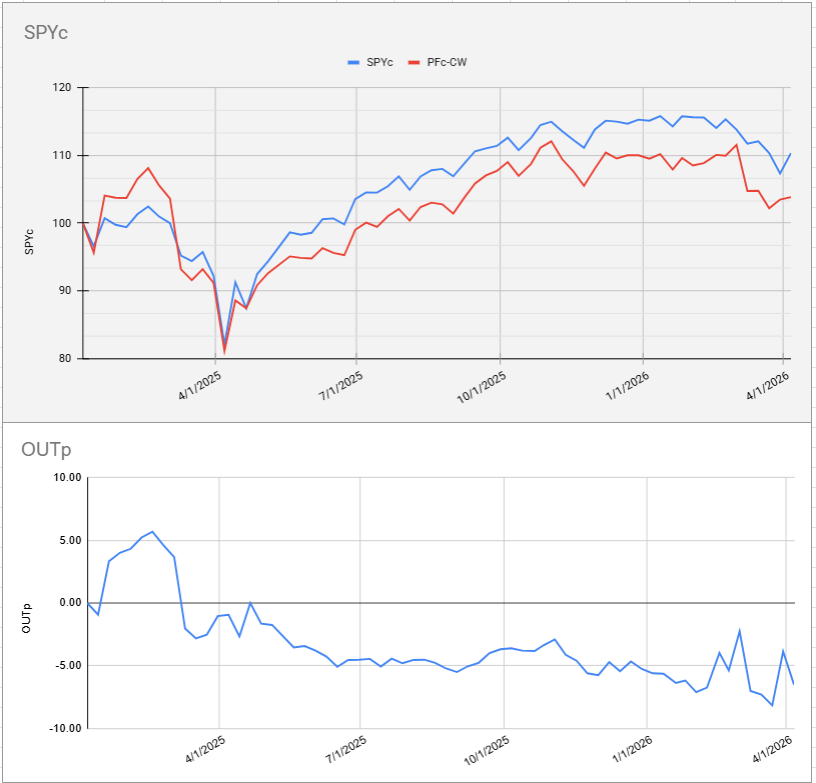
Cap‑Weighted Portfolio
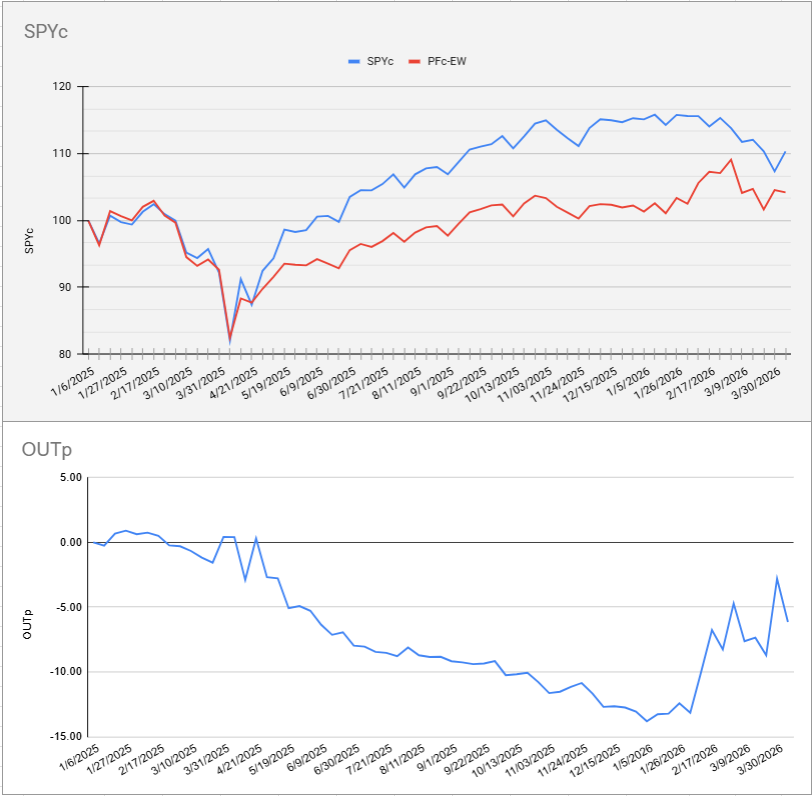
Equal‑Weight Portfolio
Source: Materials provided by https://articles.stockcharts.com.Note: Content may be edited for style and length.