
In 2025 the U.S. Dollar Index dropped sharply, sending many analysts to the bearish side. Most of my trend tools still show a down picture, but a small bounce could flip the signal to bullish.
Long‑Term Technical View
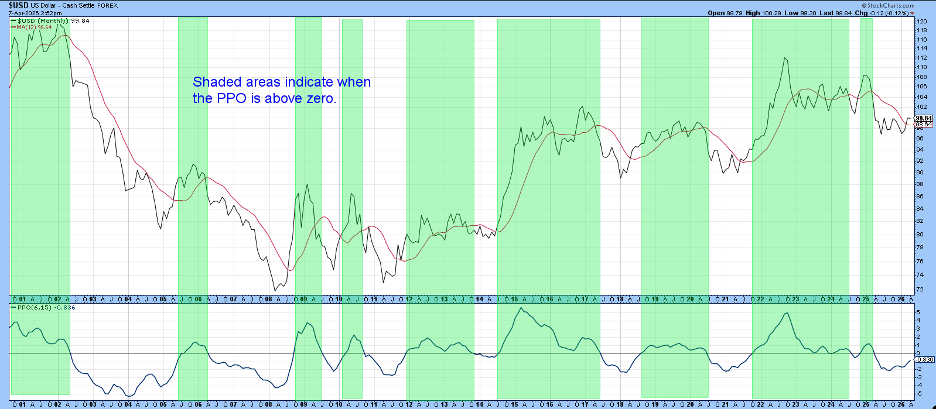
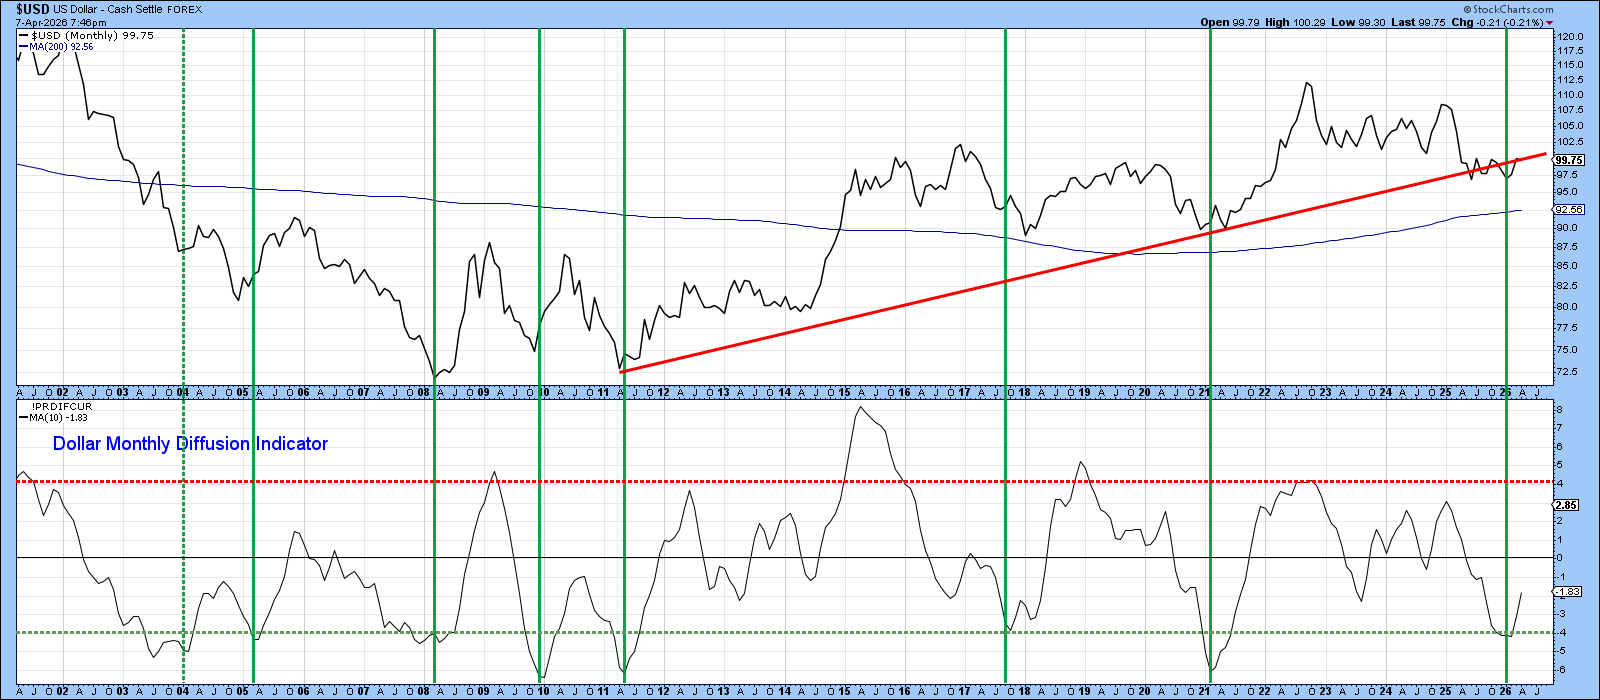
The first chart below shows the long‑term picture. Green shaded areas mark times when the Percentage Price Oscillator (PPO) was above zero – a sign that the dollar usually stays strong. Right now the PPO is still negative, but it is moving close to a possible upside cross.
The second chart keeps a bearish shape but is showing early signs of improvement. The long‑term Know Sure Thing (KST) line is turning upward, although it has not yet crossed its nine‑month moving average. Prices sit above the 12‑month moving average but are stuck inside the 2025‑26 trading range.
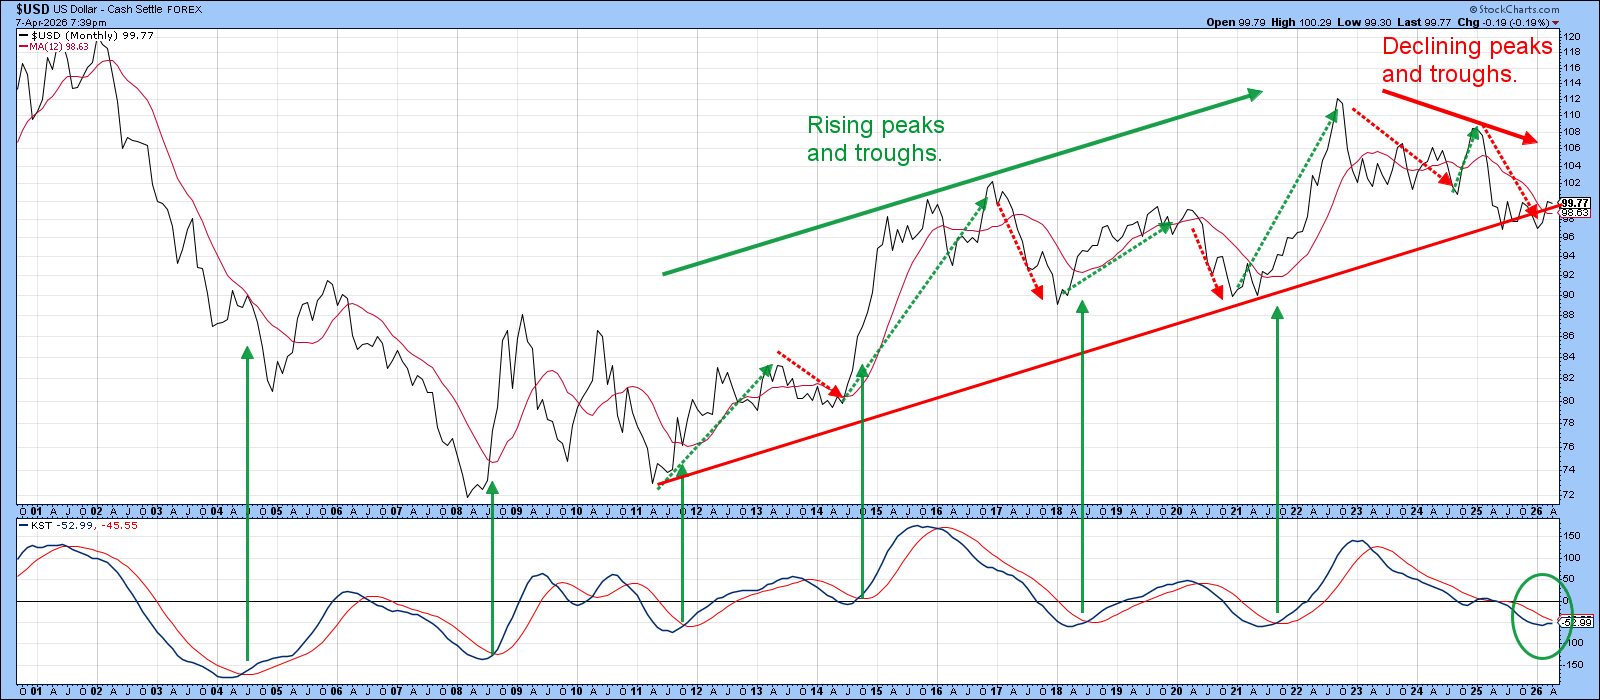
From 2011 to 2022 the Index made higher highs and higher lows. After that, it created a lower peak in late 2024 and a lower trough last year, keeping a downtrend after 2022. Still, a break above the current range would keep the long‑term uptrend line alive.
Short‑Term Signals
Chart 3 shows two clear phases. Before April 2025 the Index moved inside a range while staying above a red trendline. After that, the same line turned green and has acted as a strong barrier to the upside. The 65‑week EMA is near the same level; the price sits just above it but has not broken through decisively.
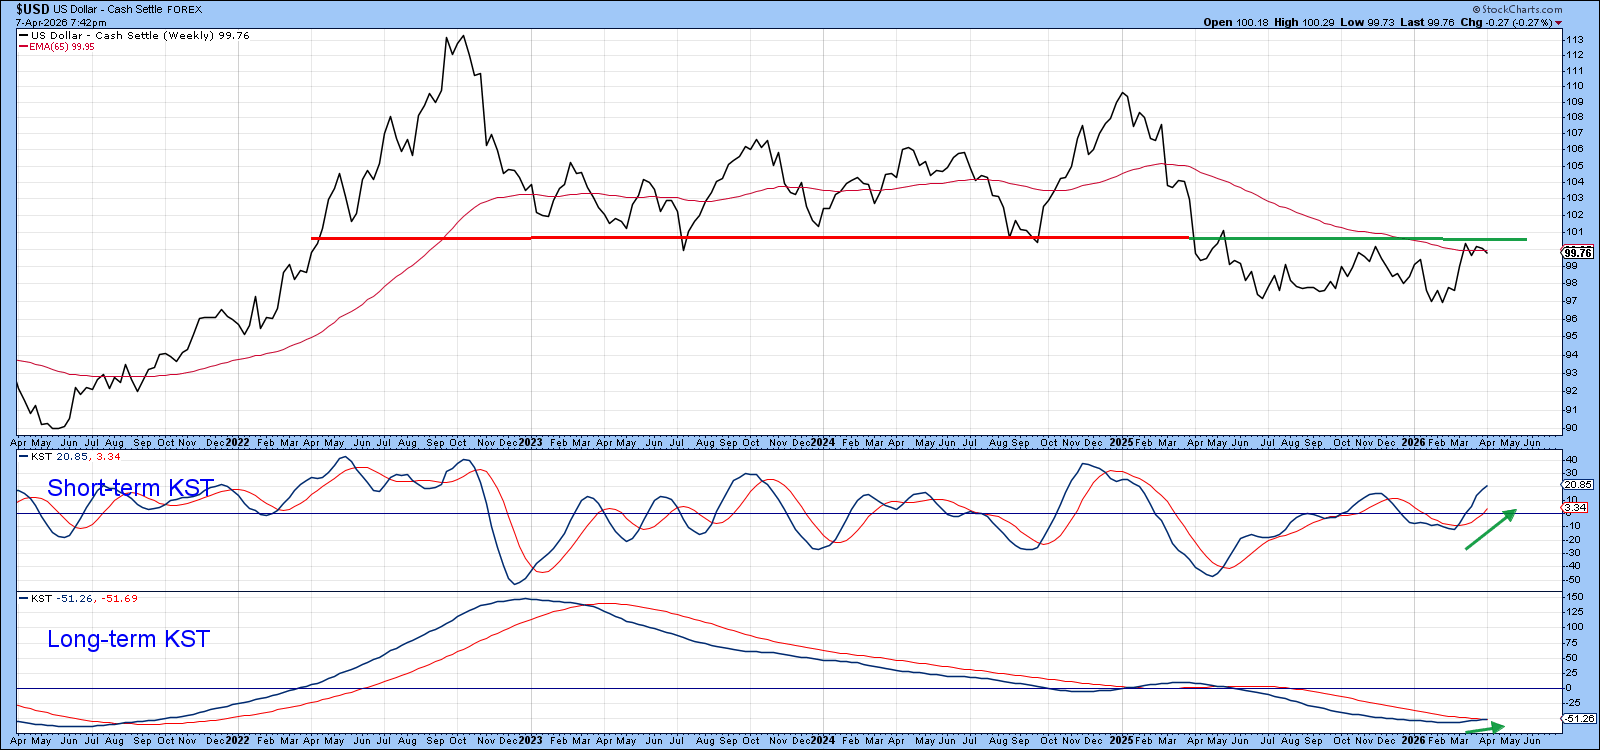
The weekly KST (a momentum indicator) is now slightly bullish, and the short‑term KST is fully bullish, hinting that a breakout could be on the horizon.
The breadth‑momentum indicator, which looks at a basket of cross‑currency pairs, just gave a new buy signal. Historically, this line has correctly pointed out dollar rallies many times, so the fresh signal is encouraging.
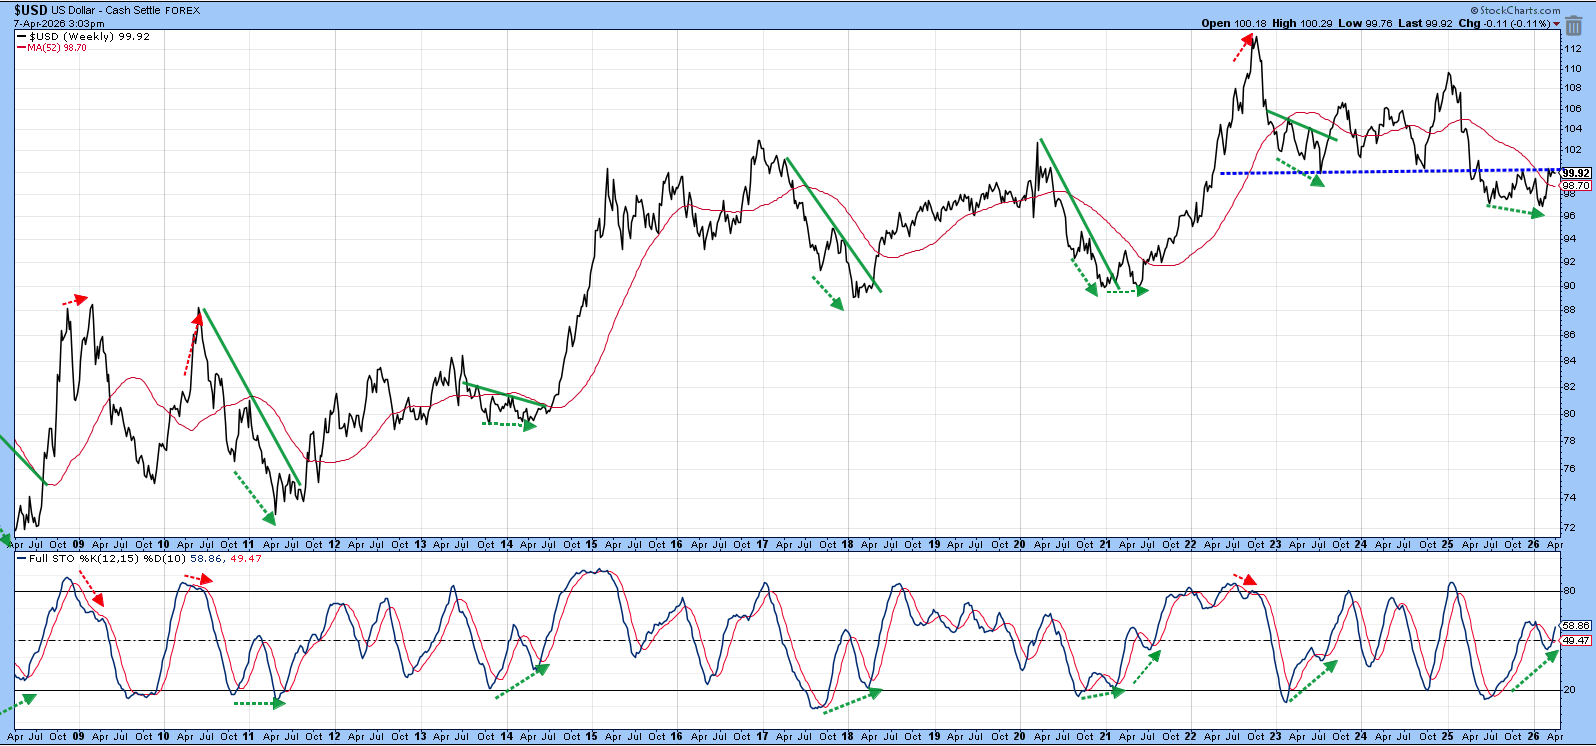
The weekly stochastic is showing several positive divergences. If the Index can close above the blue resistance trendline (around 100.2‑100.5), the bullish move would be confirmed.
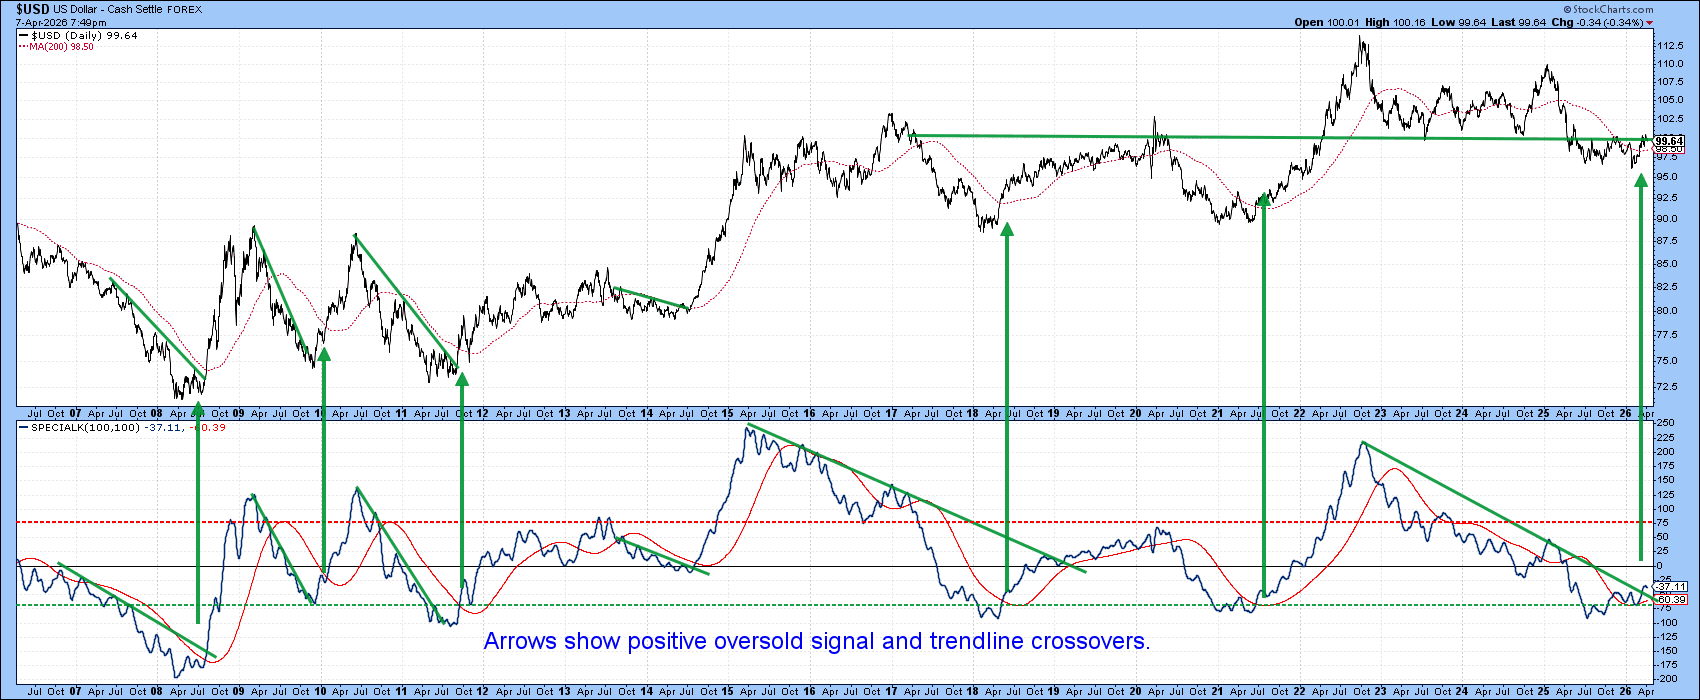
The long‑term Special K indicator just crossed above both its signal line and the bear‑market trendline from an oversold level. If the price pushes above the green resistance near 100, this could become the sixth major rally signal since the 2008 crisis.
Bottom Line
Overall, the long‑term tools still show a slight bearish tilt, but the faster indicators are turning more positive. A modest rise above the 100‑101 zone could shift the primary trend toward bullish.
Source: Materials provided by https://articles.stockcharts.com.Note: Content may be edited for style and length.