
On March 20 the stock market showed a very weak reading. That weak reading can be a clue that a big move up is coming. The clue is called the Zweig Breadth Thrust (ZBT).
What Is the Zweig Breadth Thrust?
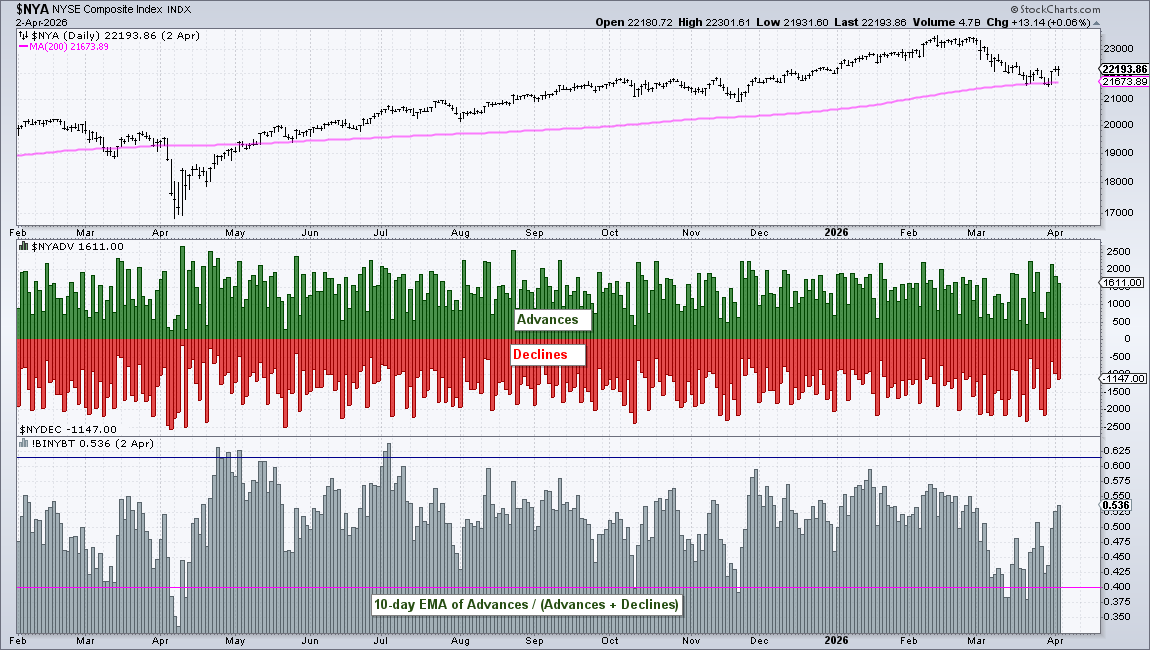
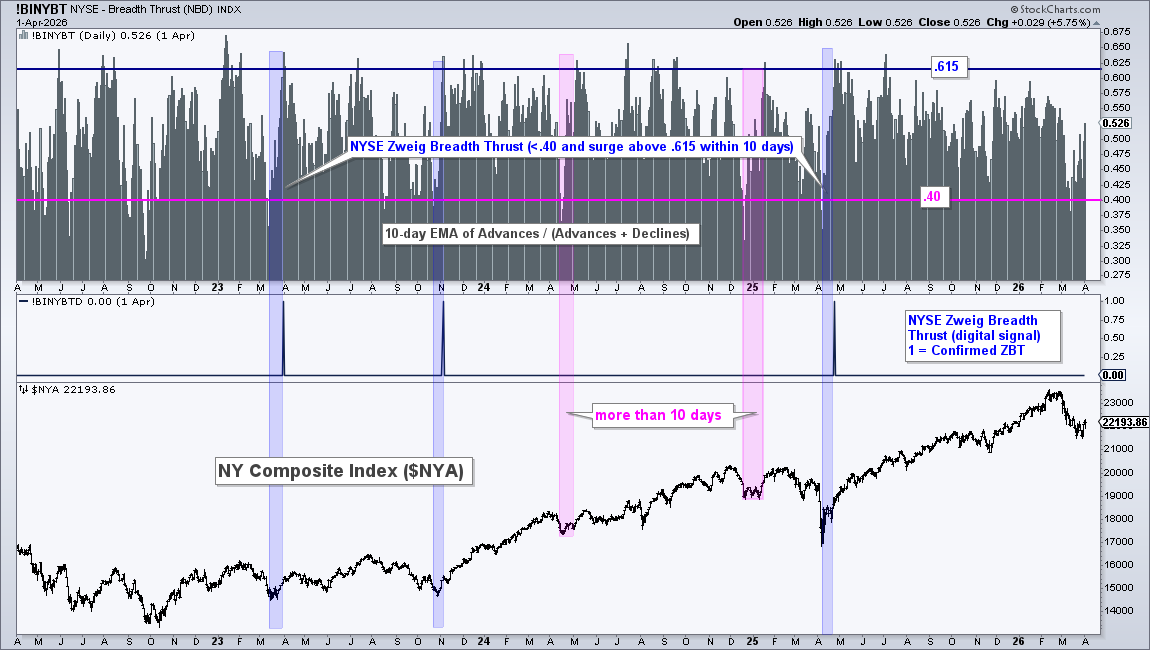
The ZBT looks at how many stocks go up compared to how many go down on the NYSE. It uses a 10‑day moving average. When the value falls below 0.40, it means most stocks are falling. If the value then climbs above 0.615 within ten days, the indicator flashes a bullish signal.

Why the Signal Matters
A low reading (< 0.40) shows a market that is very weak. When the reading quickly jumps above 0.615, many more stocks start to rise. This sudden surge of buying is called a “stampede.” It often marks the start of a strong bull market.
How to Spot a Setup
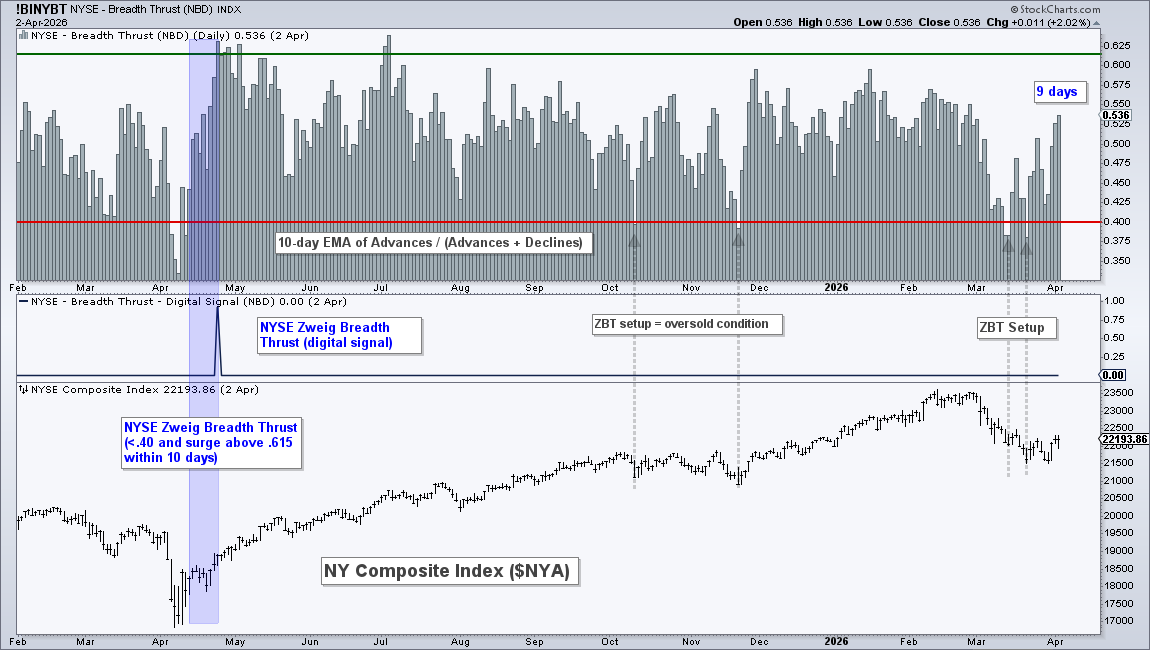
Look for the ZBT line dropping below 0.40. That is the “setup” phase. After the setup, count the days. If the line climbs above 0.615 within the next ten days, the thrust is confirmed.
Recent Example
In March the ZBT fell below 0.40 twice. The last dip was on March 20, and nine days have passed since then. If the line moves above 0.615 on the next trading day, a thrust would be triggered.
Using the Indicator for Timing
Trading is about odds. An oversold market (ZBT below 0.40) raises the chance of a bounce. When the thrust occurs, buying pressure is strong, which improves the odds of a longer up‑trend.
Some traders add Nasdaq stocks to the calculation because the NYSE no longer dominates the market. Modern versions of the ZBT include S&P 500 and S&P 1500 stocks and add exit rules to help manage trades.
Source: Materials provided by https://articles.stockcharts.com.Note: Content may be edited for style and length.