

The S&P 500 has been bouncing around lately. I am looking for three things that would prove the rally can keep going in April. Those things are a clear shift toward riskier stocks, better market breadth, and breakout moves in big growth companies.
Are investors choosing wants over needs?
One easy way to see how big money is feeling is to compare Consumer Discretionary stocks with Consumer Staples. Discretionary stocks react fast to how people spend money, while Staples stay steady no matter what.
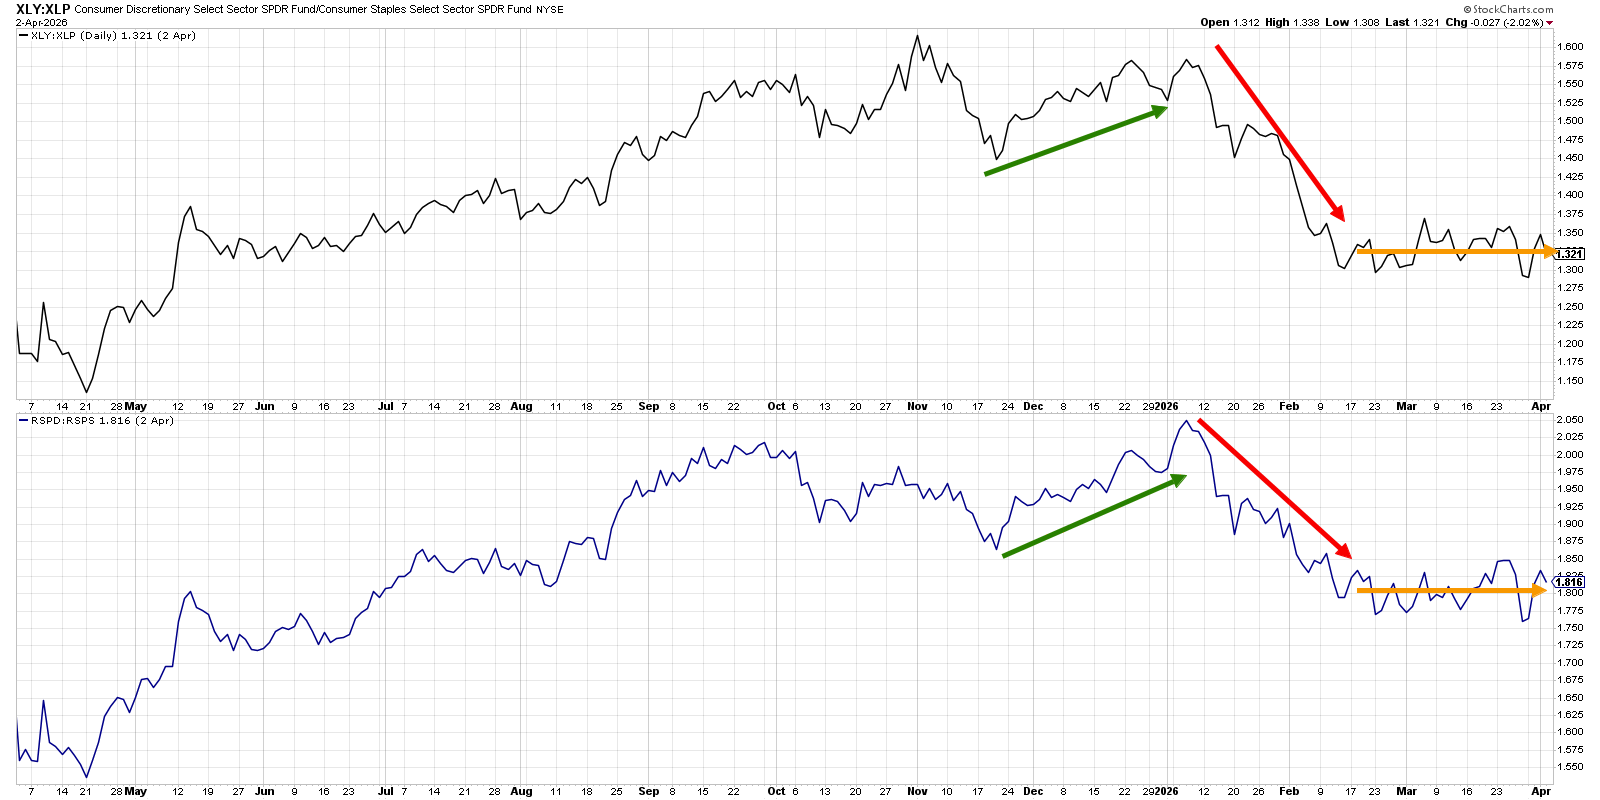
In the first half of the year, the ratio showed a defensive tilt. Since mid‑February the line has moved sideways. If the ratio climbs higher, it would show institutions are ready to bet on a market lift in the second quarter. If it falls, it would warn that investors are getting more cautious.
Do breadth numbers show a broad rally?
Only about 30% of S&P 500 stocks are above their 50‑day moving average right now. Long‑term breadth also looks weak.
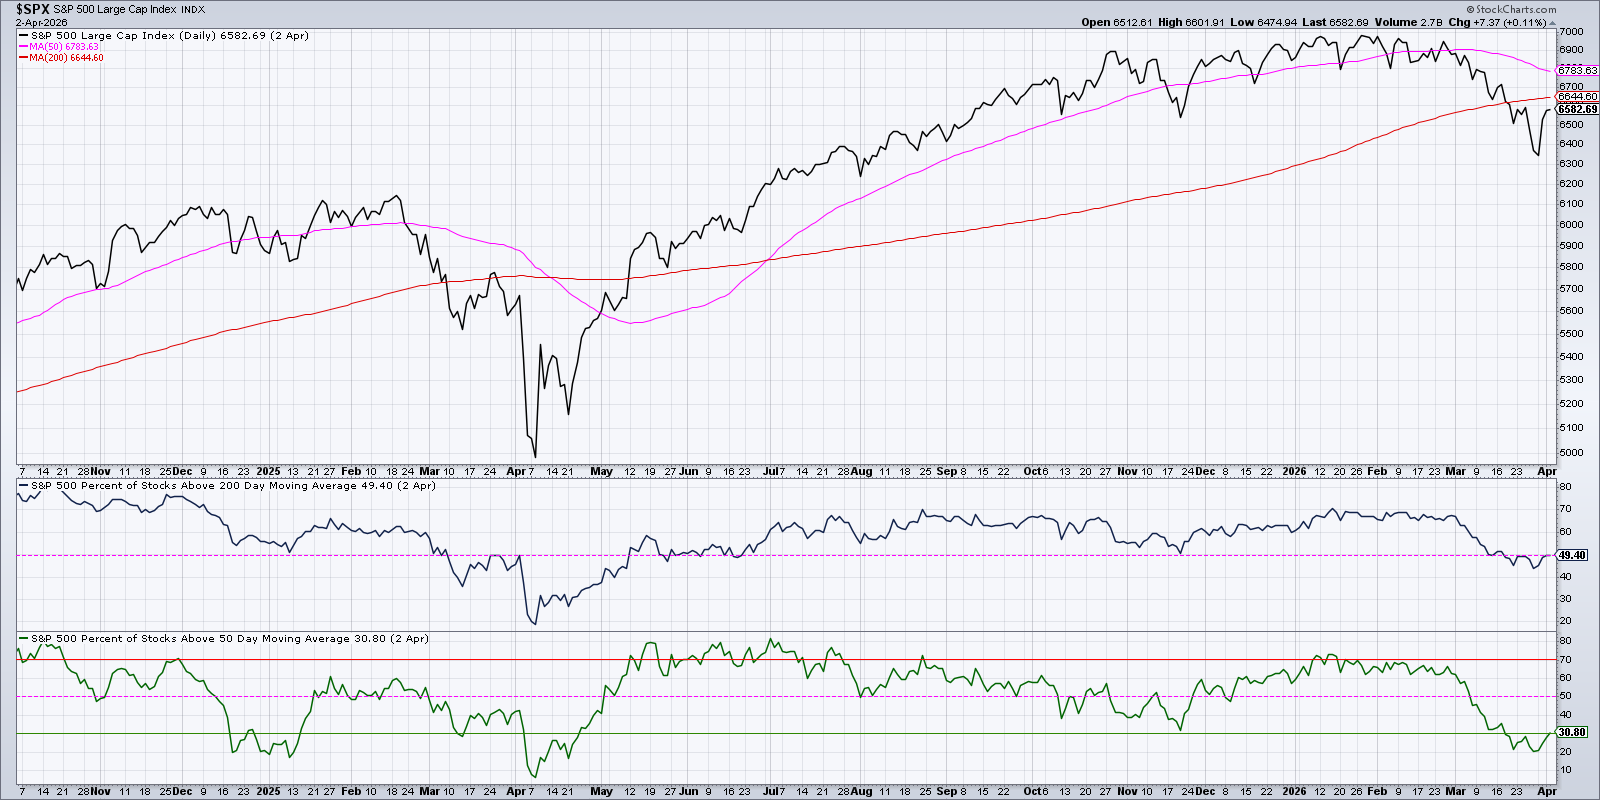
When we look at the 200‑day average, just under half of the stocks sit above it. For a bullish case, we need that number to move past the 50% mark, showing many stocks can hold their long‑term support.
Are big growth names finally breaking out?
For the S&P 500 and Nasdaq to climb higher, key growth stocks must break out of their flat patterns.
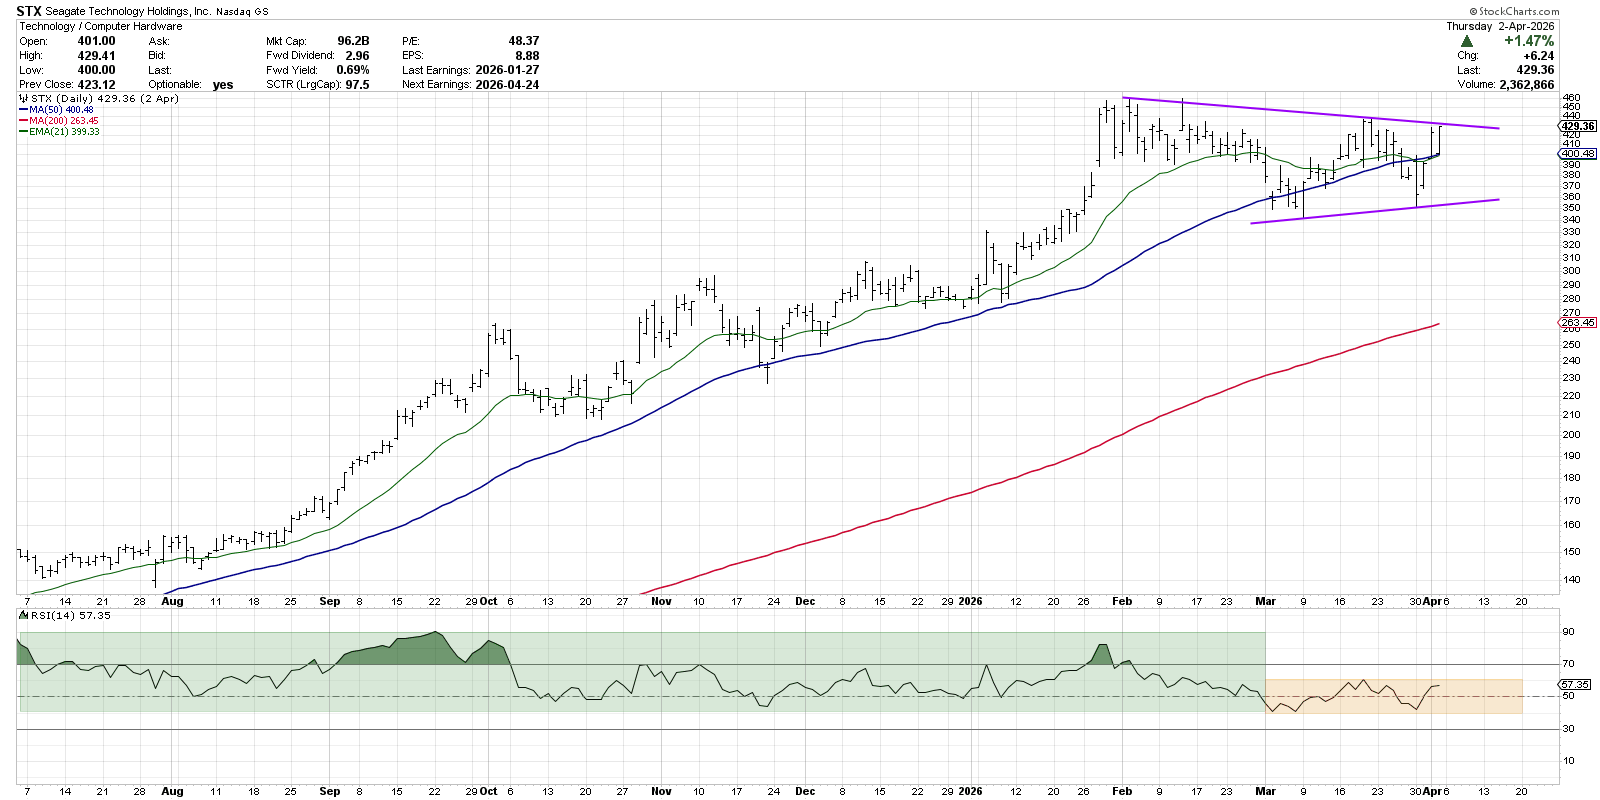
Seagate (STX) has been forming a symmetrical triangle for two months. A recent bounce pushed it to the top of that shape. An upside breakout, backed by stronger momentum, would confirm a bullish turn.
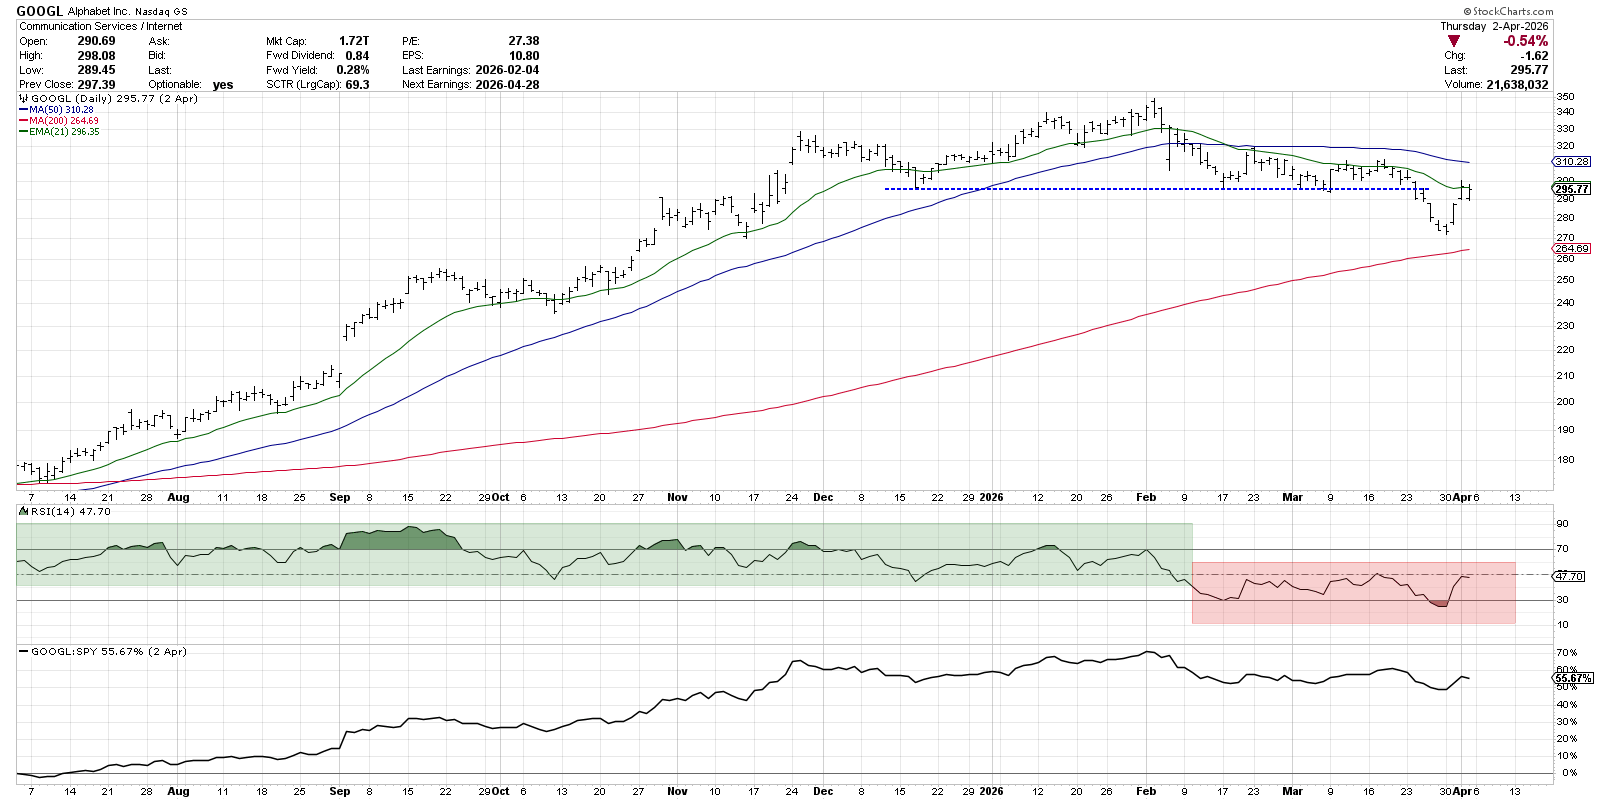
Alphabet (GOOGL) sits between a falling 50‑day average and a rising 200‑day average. If it can close above the 50‑day line, the recent dip may be over. The RSI is still below 50; a move above 60 would give the chart a bullish feel.
Even though the major indexes jumped this week, many charts still show weak or neutral signals. If these charts improve, the S&P 500 could have a lot of room to run.
Follow these charts each day as we work through a choppy April.
Disclaimer: This material is for educational purposes only. It is not financial advice. Always consider your own situation and consult a professional before acting.
Source: Materials provided by https://articles.stockcharts.com.Note: Content may be edited for style and length.