
CAC40 closes lower
The CAC40 cash index ended the session down 0.39% at 8,072.13 points, with a modest volume of €2.2 billion.
The Paris stock market slipped a little, pressured by a jump in Brent crude oil, which is near its highest level since early April. Traders are waiting for the U.S. Federal Reserve’s next move and for comments from Chairman Jerome Powell.
According to the CME FedWatch tool, the chance of rates staying between 3.50% and 3.75% is almost certain.
Geopolitical news also weighed on the market. The Iran situation dominated headlines. Former President Donald Trump said he is not happy with Iran’s latest proposal. The main dispute is over Iran’s nuclear program – Iran wants to discuss it after hostilities end, while the United States wants it addressed right away.
On the stock side, Airbus performed best, rising 5.13% to €174.62 after reporting quarterly sales of €12.65 billion, above expectations. Defense and space activities stay strong, but commercial aviation is hit by slower deliveries and a weak dollar.
May Futures Outlook
Resistance levels: 8,332; 8,475; 8,652.5
Support levels: 8,237.5; 8,201.5; 8,162.5; 8,090; 8,062; 7,984; 7,961; 7,834; 7,719; 7,669; 7,540.5
In intraday trading, the bias turns bearish below 8,024 points.
Technical charts (data as of 2 PM) show continued selling pressure. Bearish traders have taken the lead over the past four sessions. Watch for a possible indecision candle with lower volume, which could signal that the downtrend is losing steam.
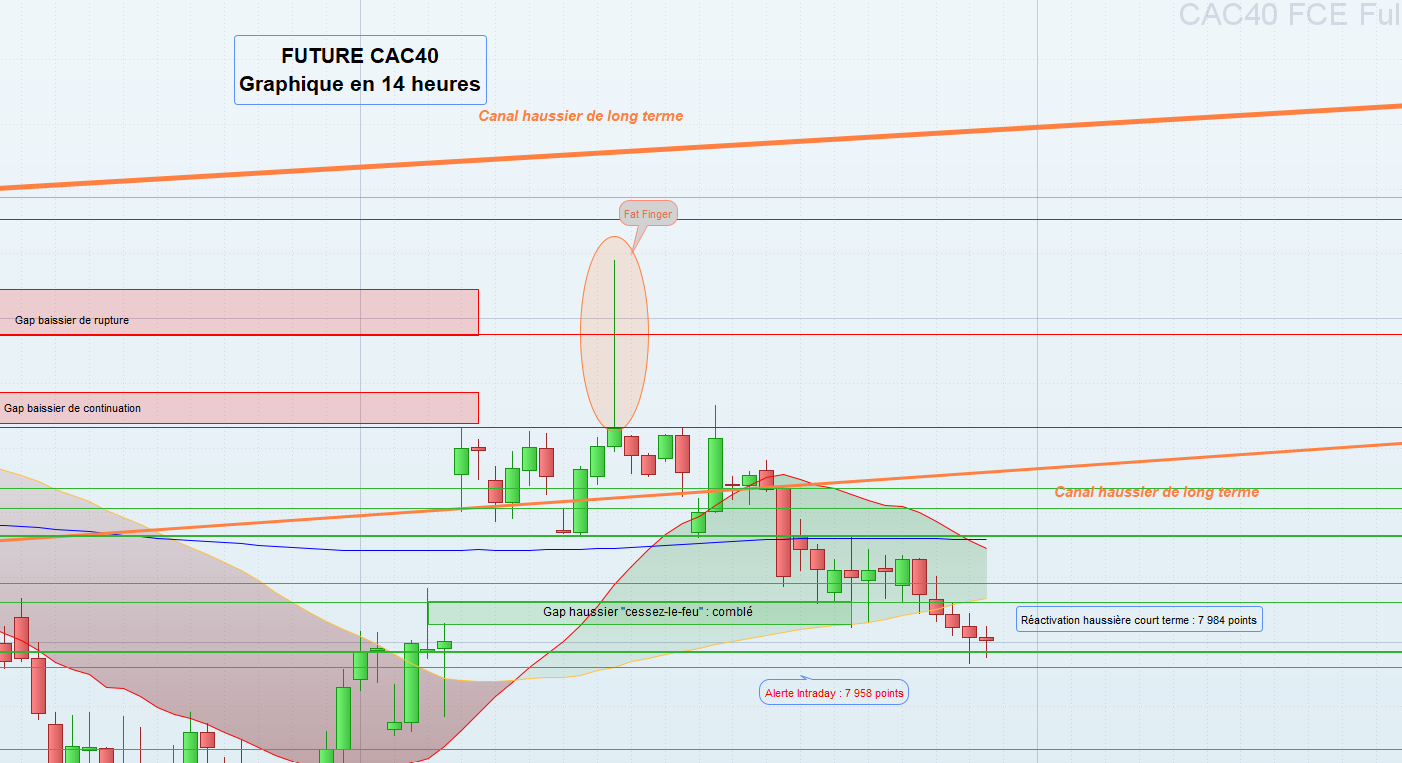
The index is now trading in a tight range between roughly 8,010 and 7,960 points – a zone where buyers and sellers are evenly matched. This area was once a resistance that turned into support after the April 8 cease‑fire announcement.
If the price falls below the lower edge of the upward gap opened on April 8, the next watch‑point is 7,958 points intraday. A deeper drop could trigger a larger correction, possibly pushing the index toward the 7,540 area.
Note: The spike seen on April 14 was caused by a “fat‑finger” order entry error. This anomaly is excluded from the daily analysis.
Conversely, the bullish gap opened on April 7 and filled on April 23 has acted as strong technical support. As long as the index stays above the base of that gap, the chart still favors higher moves.
A re‑entry into the long‑term upward channel, whose lower bound is near 8,270 points, would be an encouraging sign. That could lead to filling the continuation gap between 8,336 and 8,358 points, and later closing the local breakout gap between 8,473.5 and 8,544 points. The next target would be the top of the long‑term channel, around 8,800 points.
Indicator Summary
The index is trading below its 20‑, 50‑ and 200‑day moving averages. MACD histograms are rising but stay under the signal line. The RSI is neutral, and volumes are down compared with the previous session.
Conclusion
With ongoing geopolitical uncertainty and volatile markets, we are taking profits on positions such as Edenred and Eutelsat today. Any new stock additions will wait for clear technical signals. Protective hedge strategies remain in place to manage overall market exposure.