

The S&P 500 index keeps climbing higher. It is now above 7,200 for the first time ever. The Relative Strength Index (RSI) has stayed near 70 for three weeks, which means the market has strong momentum.
What Overbought Means
When the RSI shows an overbought condition, it can look like a warning sign. But it also often confirms that a long‑term uptrend is still in place. The chart of Broadcom (AVGO) shows how strong momentum can lead to more gains.
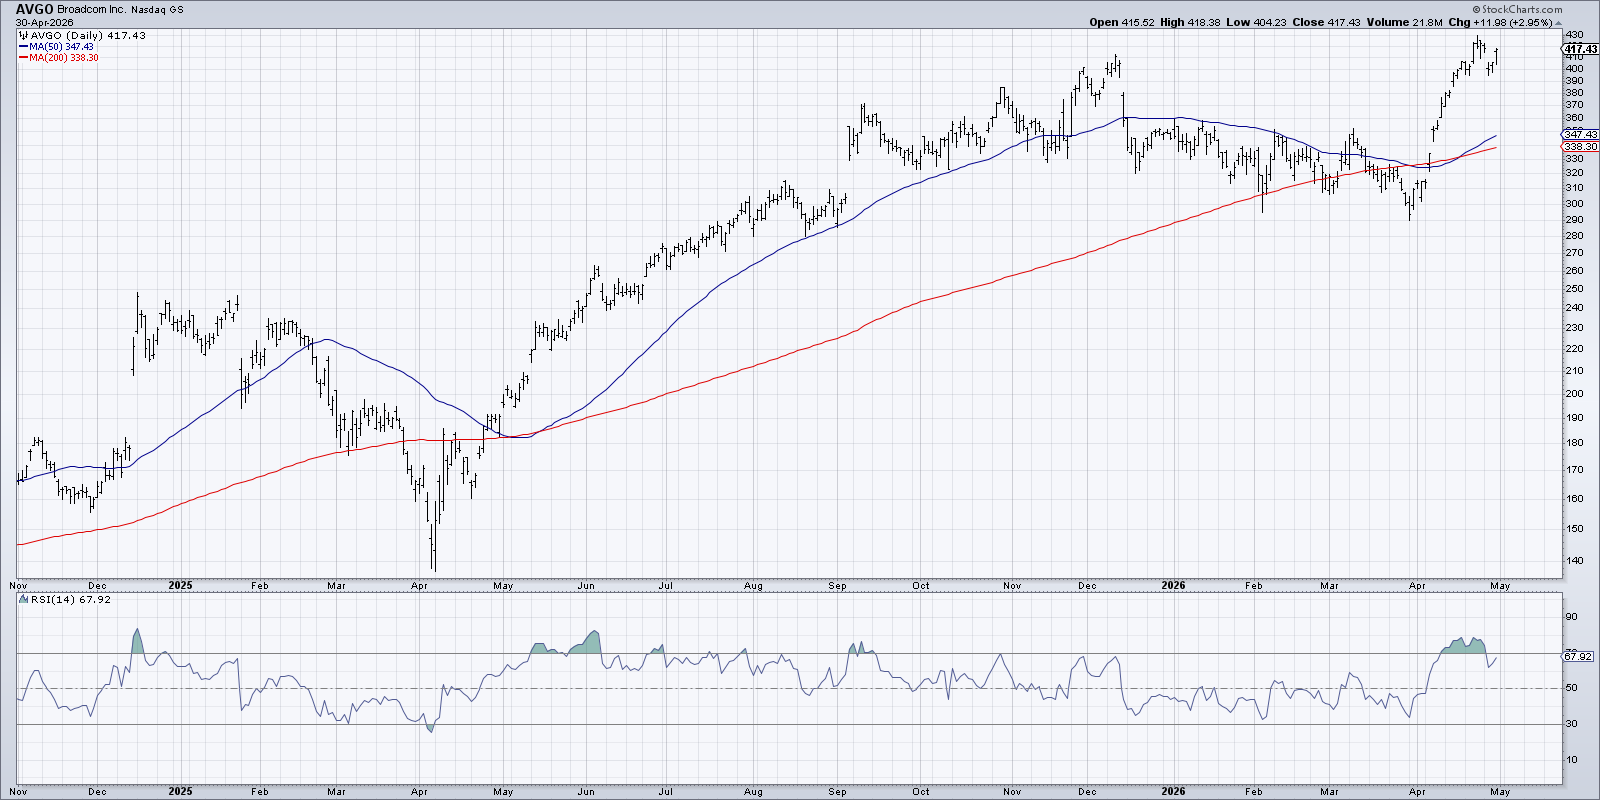
In May 2025, Broadcom broke out above $210. The RSI went into overbought territory, showing strong upward pressure. The stock kept climbing to a peak near $410 in December. Even when the price pulled back, the RSI stayed above 50, reinforcing the uptrend.
When Momentum Weakens
Higher prices with lower momentum can be a warning sign. Ford Motor Co. (F) displayed a clear bearish divergence in early 2026.
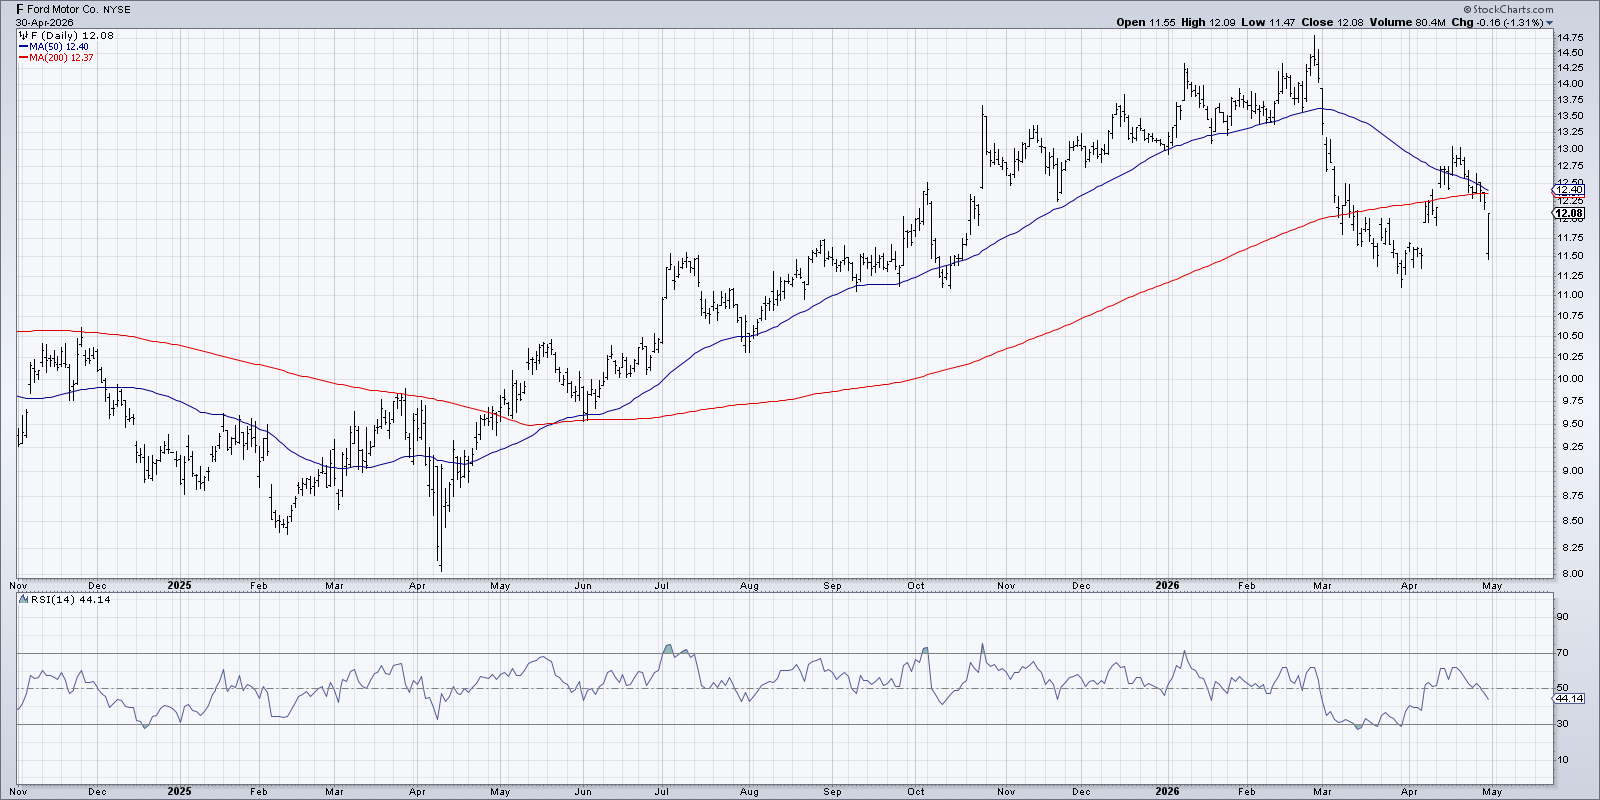
During 2025, Ford’s price made higher highs while the RSI sloped lower. The RSI never fell below 40 during those pullbacks, meaning buyers kept stepping in and the uptrend survived. The 50‑day moving average acted as a support line. The trend finally turned when the RSI dropped below 40 and the price broke through the 50‑day average.
Current S&P 500 Outlook
Looking back at the S&P 500 chart, the recent overbought RSI supports a bullish phase, just like Broadcom’s example.
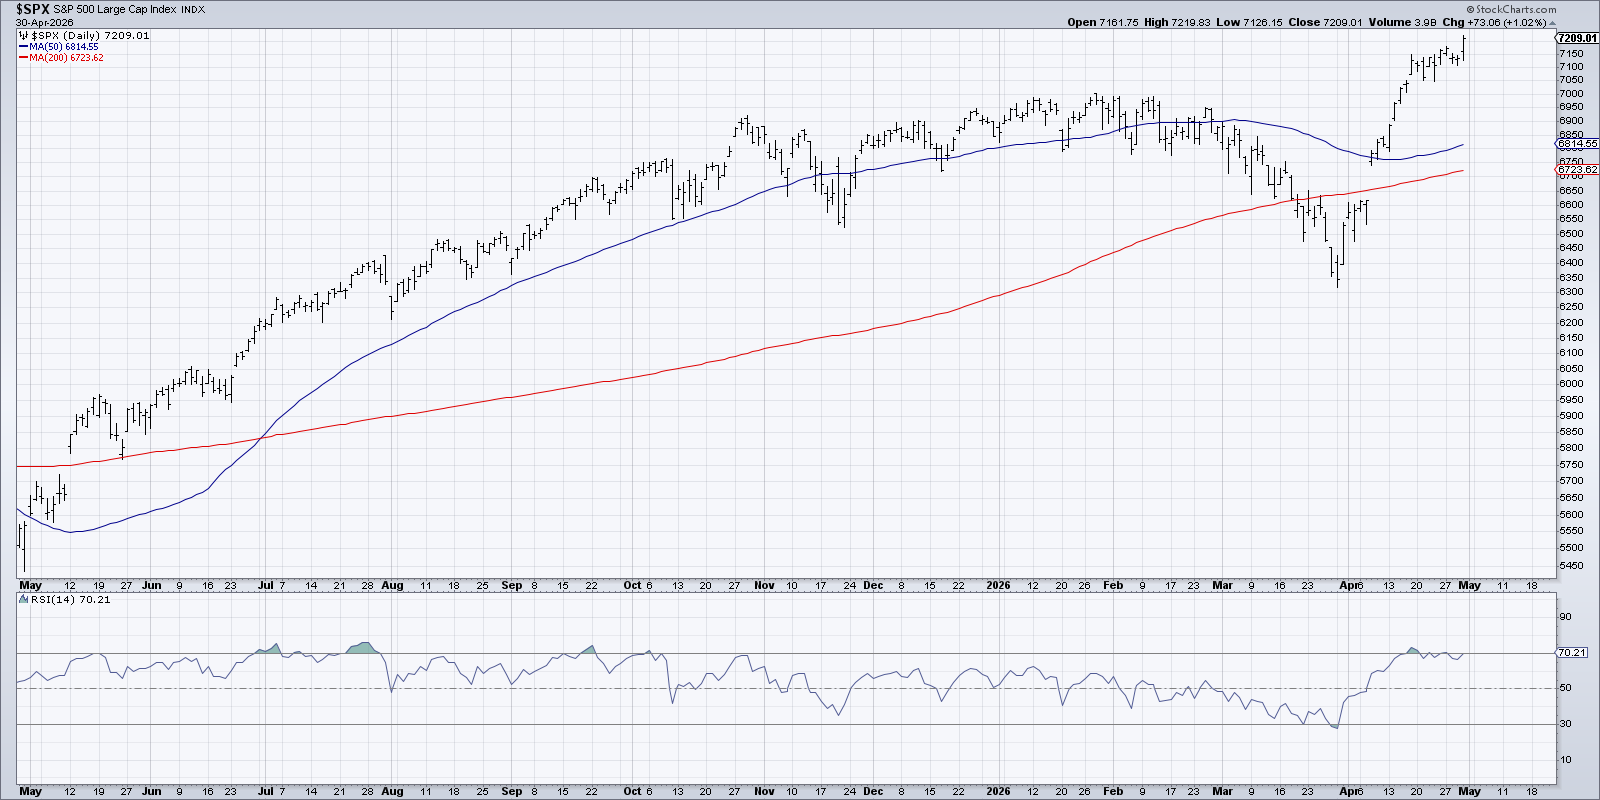
There are no clear bearish divergences in the index, so the uptrend looks solid. As long as the S&P 500 makes higher highs and higher lows, and the RSI stays above 40 on pullbacks, the primary uptrend remains intact.
Investors can keep things simple. By watching trend and momentum signals, you can stay in the market while the uptrend lasts.
Disclaimer: This material is for educational purposes only and does not constitute financial advice. Always consider your personal financial situation or consult a professional before making investment decisions.
Source: Materials provided by https://articles.stockcharts.com.Note: Content may be edited for style and length.