
This week was hard for many investors.
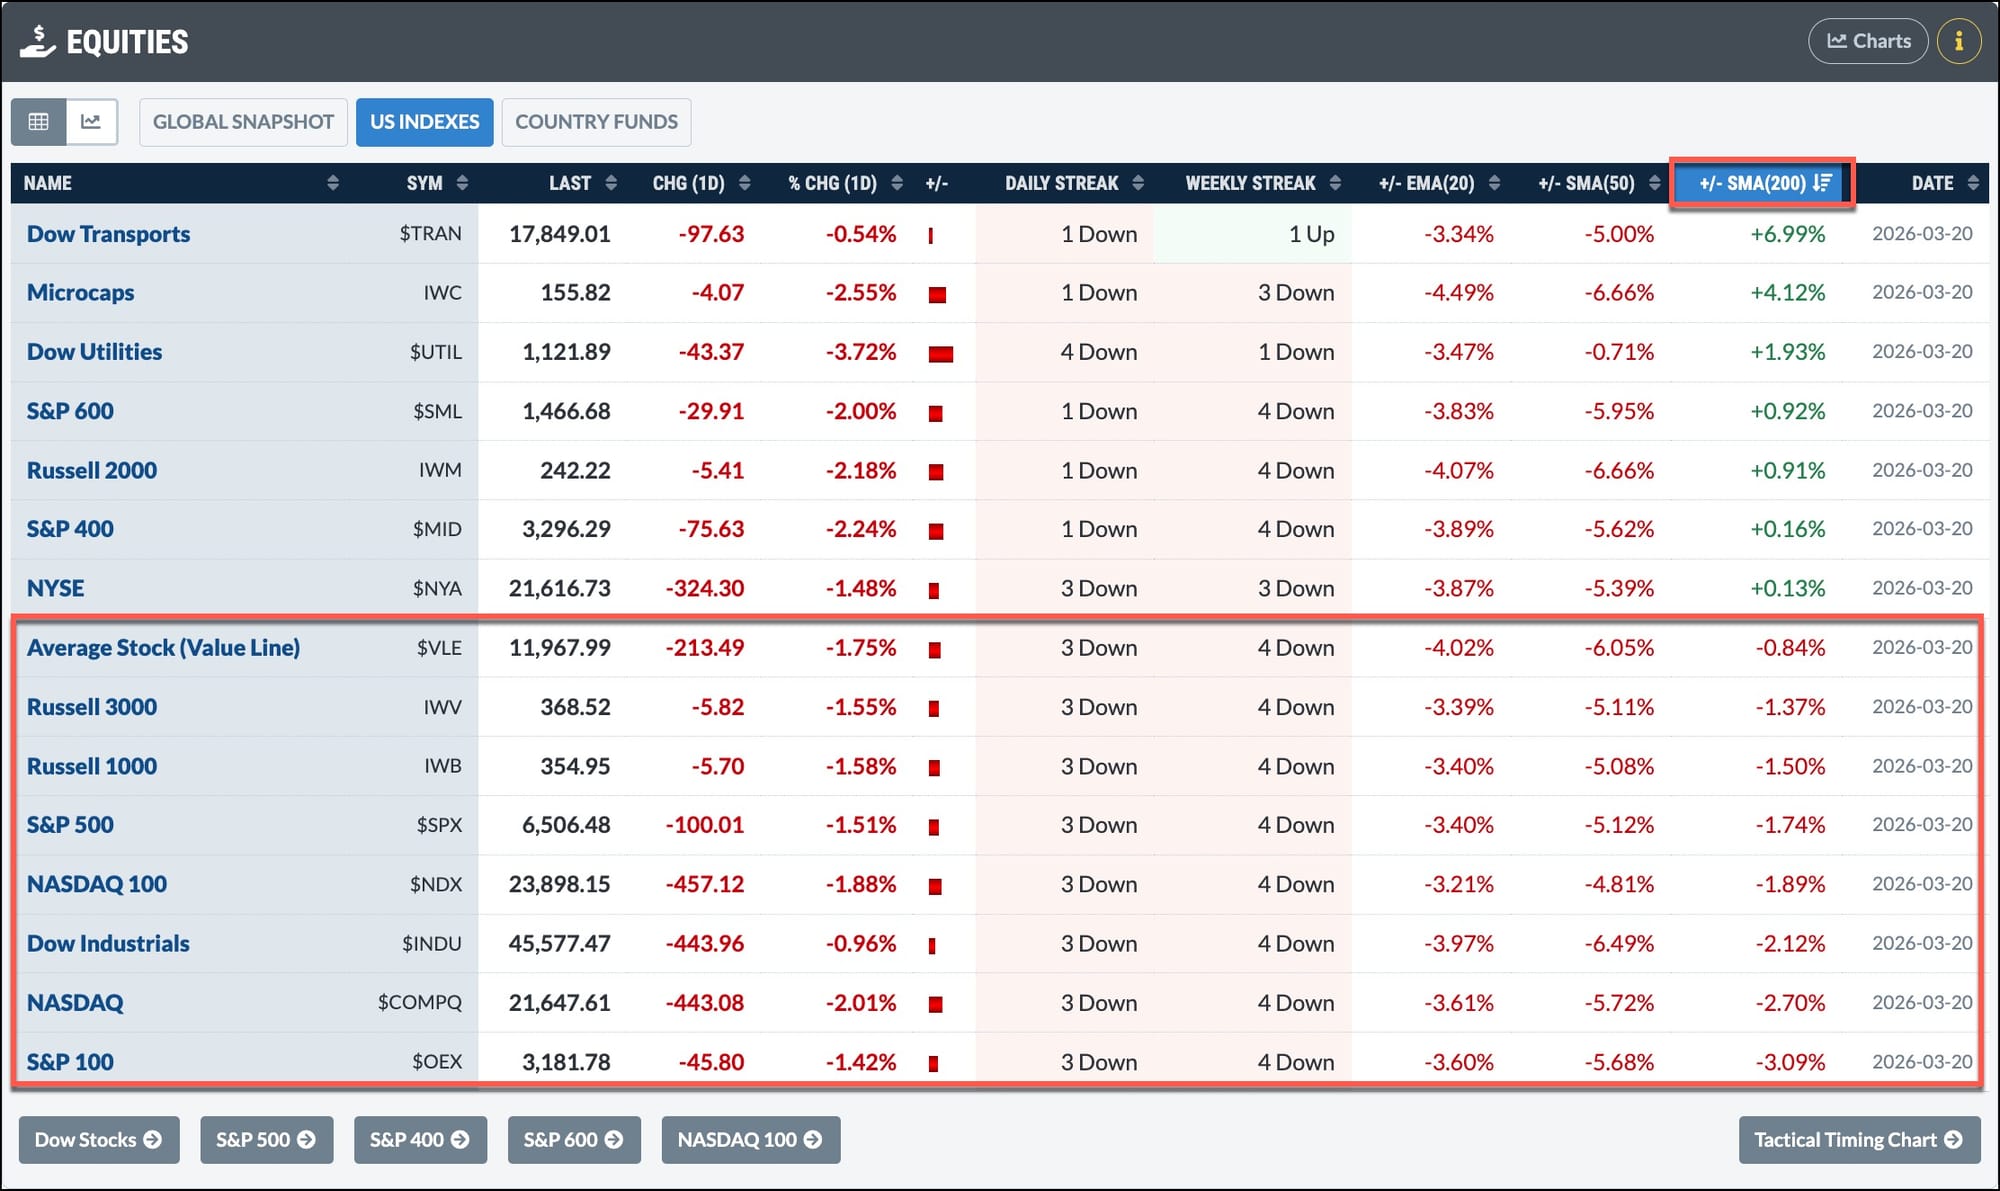
The volatility index rose, while the S&P 500 fell below its 200‑day moving average and slipped under last November’s low. Treasury yields jumped, and market breadth weakened. Looking at the equities overview, about half of the U.S. indexes are now under their 200‑day average, a big change from just a week ago.
Even though the picture isn’t bright, it reminds us that markets do not climb forever. Some traders have already cut positions and moved to cash, a sensible step in this setting. The market will eventually find stability and rise again, but those signs are not visible yet.
In a recent note I discussed charts that can show when investors are giving up. This week’s collection adds thoughts on what big‑cap charts are saying, how to detect weakening breadth and momentum, what sentiment gauges reveal, and a simple options idea for falling stocks.
The main lesson is to watch the charts—they often signal a change before the news does.
Recent price moves suggest investors become careful before weekends, often lowering stock exposure on Fridays because of ongoing geopolitical worries. New U.S. troop moves to the Middle East add more uncertainty. Last Friday was also “quadruple‑witching,” a day when many contracts expire, creating extra volume and volatility.
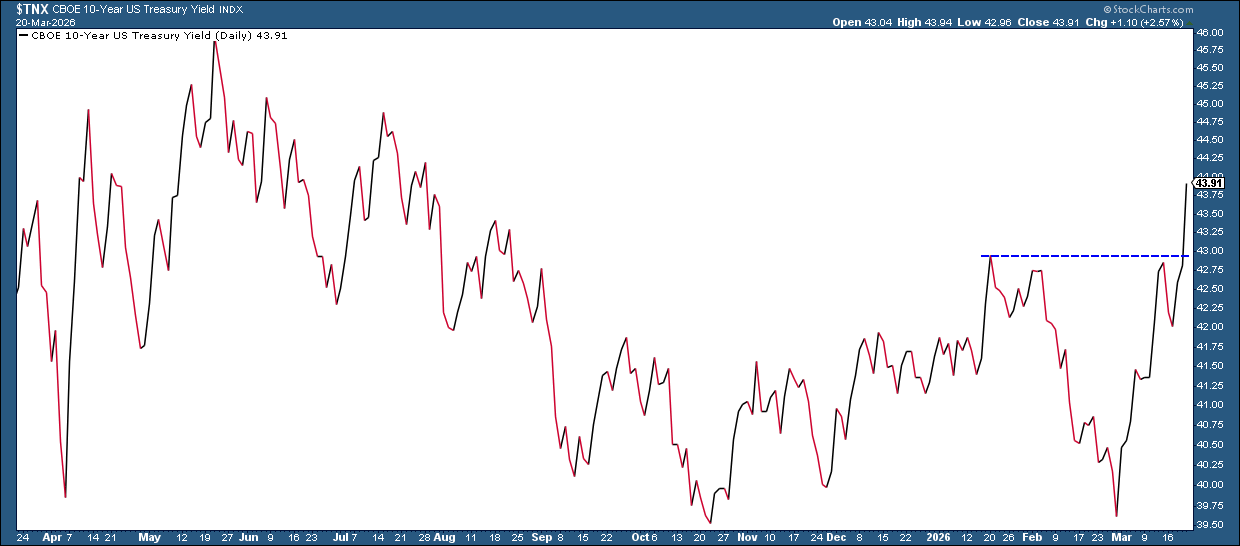
Central banks this week sent the same message: inflation is still a problem. After Chairman Powell’s comments, the market stopped expecting rate cuts in 2026, which pushed bond yields higher. The 10‑year U.S. Treasury yield rose to about 4.39%, the highest this year. Yields will only ease if global stability improves.
Precious metals have been hit hard, and cryptocurrencies have not recovered since their sharp drop in October. Few sectors show strength right now, except some energy stocks that look a bit better.
Still, a falling market can be a good time to step back, watch closely, and get ready to act when conditions improve.
Enjoy the weekend, and we’ll be back with more insight next week.
Source: Materials provided by https://articles.stockcharts.com.Note: Content may be edited for style and length.