
The market moved with a weak tone all week. After a brief try to hold steady, the Nifty 50 fell a little and finished just below the red line. It swung inside a 931‑point band and ended near the lower edge of that band.

Fear in the market grew a bit. The India VIX rose 0.74% to 22.81, showing traders were more nervous. The index slipped 36.60 points, or 0.16%.
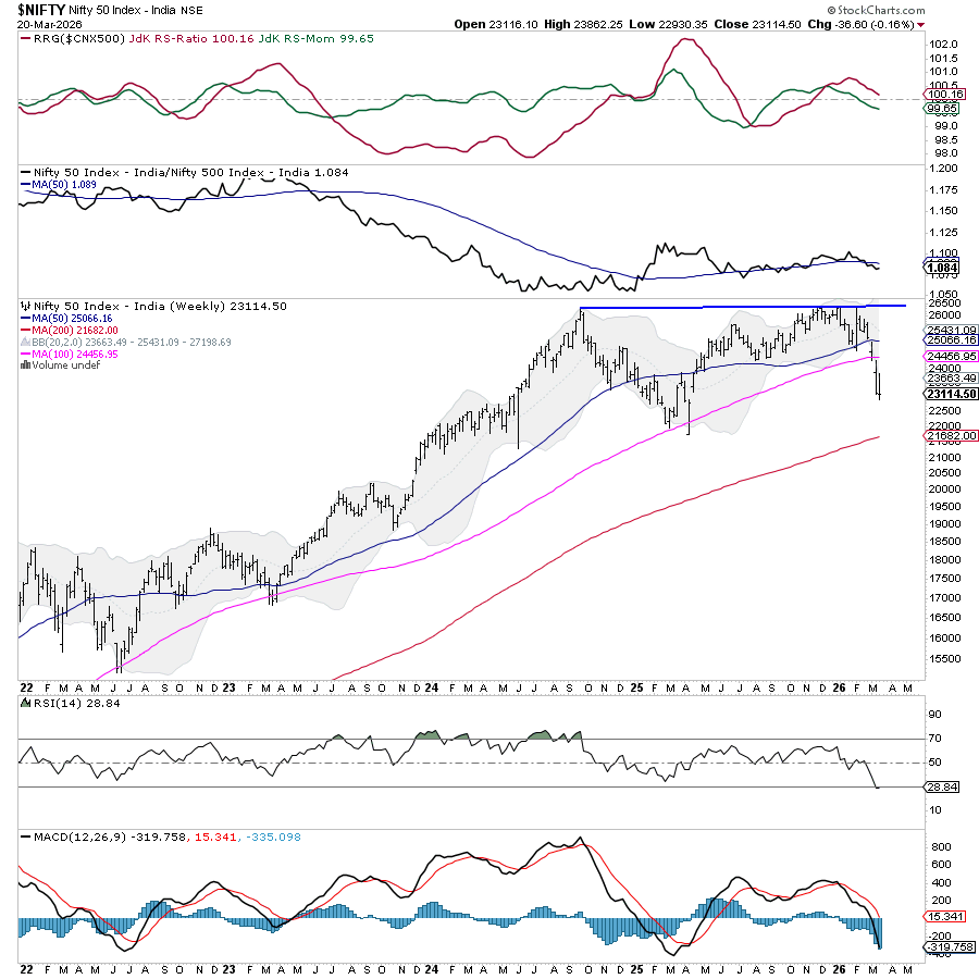
The overall technical picture looks weaker. The Nifty broke through its middle‑term support area and fell below important moving averages. It is now under both the 50‑week and 100‑week averages, a sign that the trend is losing strength.
As long as the index stays below the 23,450‑23,600 zone, pressure will likely continue. A move back toward this area could meet selling pressure. Only a clear rise above the band would calm the short‑term bearish outlook.
Because of the short trading week caused by the Ram Navami holiday, the next session may start cautiously, possibly with a gap. Key resistance points sit at 23,450 and 23,650, while support levels are around 22,900 and 22,650.
The weekly RSI is 28.84, placing it in oversold territory. It follows price direction without any strong divergence, confirming weakness. A new 14‑period low has formed. The MACD stays bearish, below its signal line, and the histogram is expanding negative, adding to the downside push.
From a pattern view, the Nifty sits well under two of its three main averages, a typical bearish sign. It also closed below the lower Bollinger Band, suggesting the market is stretched low for now, though not a sign of an immediate bounce. The 200‑week average near 21,680 now acts as a long‑term support if the fall continues, though a short‑term bounce within the band can’t be ruled out.
For the upcoming week, a defensive stance is advisable. Even though the market looks oversold, any short‑term bounce may meet resistance higher up. New aggressive buying should wait until clear stability appears. Traders should protect capital, keep positions small, and focus on individual stocks rather than broad bets. Any rise should be used to cut exposure, not to start new long positions.
Sector Outlook for the Next Week
Using Relative Rotation Graphs (RRG) we compared several sectors against the CNX500, which represents over 95% of the market’s free‑float value.
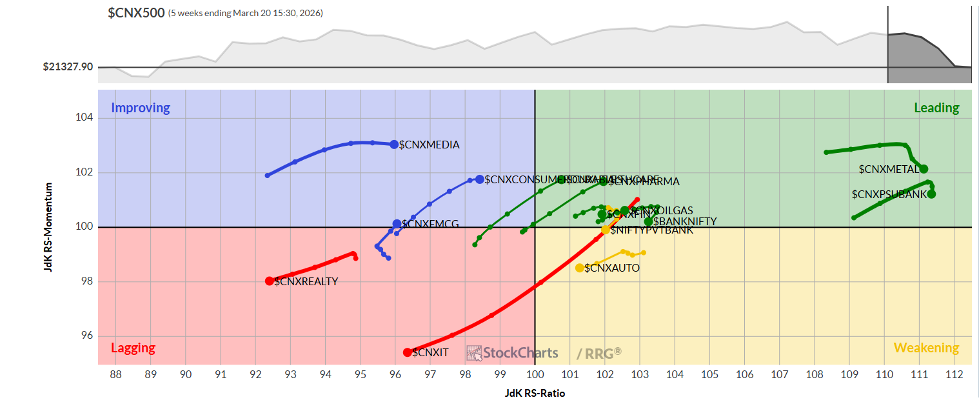
The Energy sector stays solid in the leading quadrant, showing good relative strength. The Power, Pharma, and Infrastructure groups also sit in this quadrant, hinting they could outperform the broader market.
Metals, PSU Banks, Bank Nifty, and Financial Services are also in the leading quadrant but are losing some momentum. They may not fall sharply, but their outperformance could slow.
Auto and Mid‑Cap 100 indices remain in the weakening quadrant, suggesting they may lag while individual stock moves are still possible.
Services moved into the lagging quadrant, and both Realty and IT groups are also lagging, indicating they could underperform.
FMCG and Media indices shifted into the improving quadrant, pointing to potential relative gains ahead.
Note: RRG charts display relative strength and momentum versus the NIFTY500 index. They are not direct buy or sell signals.
Source: Materials provided by https://articles.stockcharts.com.Note: Content may be edited for style and length.