

Last week was rough for many markets. The S&P 500 fell hard, gold dropped below $4,100 an ounce, and bond yields jumped to levels not seen in years. The moves were driven by headlines, with traders attacking safe‑haven assets.
Investors are now looking for where the market might find a bottom. Let’s start with the basics and see if the recent bounce has any staying power.
Bearish Pattern Gains Momentum
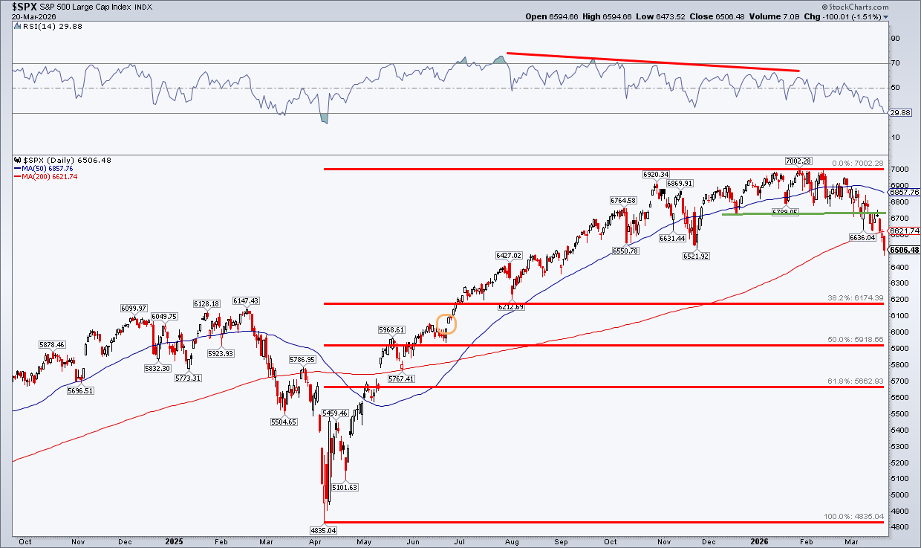
On the long‑term chart, a rounded‑top pattern that started last December is now breaking down. A neckline just above 6,700 points suggests the index could slide toward 6,400. If the S&P climbs again, 6,700 may act as resistance.
Quick, sharp rallies can happen when the volatility index (VIX) is in the 20s‑30s. The market could swing about 1.5% in a day. All eyes remain on President Trump’s social media for clues.
Where Support May Form
Several levels line up in the low 6,000s. A 38.2% Fibonacci retracement of the April 2025‑January 2026 rally points near 6,174. Earlier highs around 6,147 and a gap at 6,025 also provide potential support. A move above 6,302 would keep the index out of technical correction territory.
Looking Back to 2011
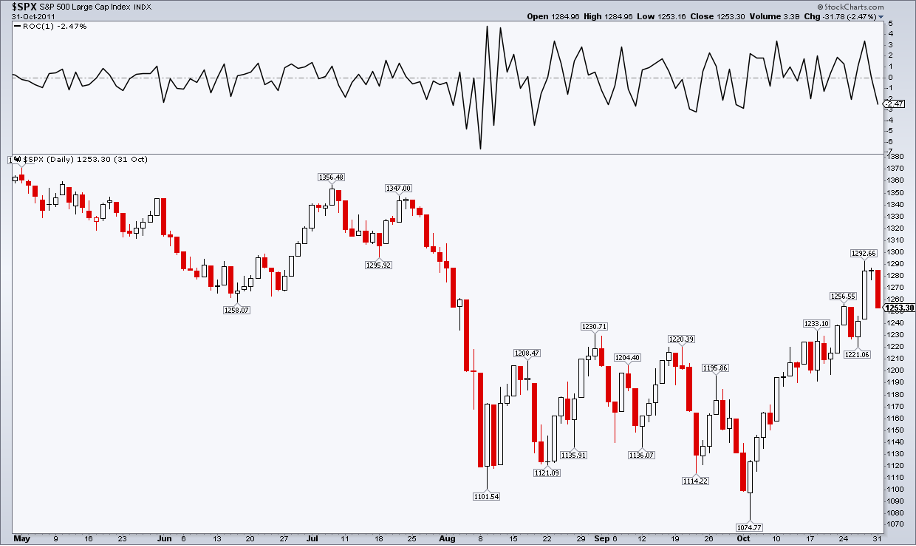
The current pullback reminds some traders of the summer 2011 European debt crisis, when the S&P fell about 19% from a peak on April 30 to a low on October 4. Volatility spiked, and short‑term swings of ±5% were common.
Back then, global stocks and U.S. small caps were hammered. Unlike some recent dips that recovered quickly, the 2011 decline featured several relief rallies that were later swallowed by bears.
Hope on the Oil Front
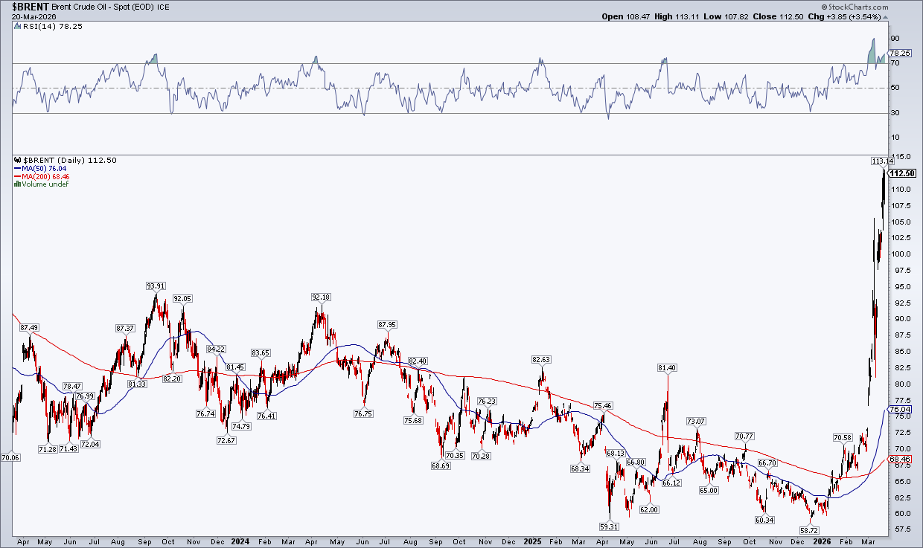
One bright spot is oil. West Texas Intermediate is holding near $100 a barrel, while Brent hovers around $115. Recent spikes have settled, but U.S. gasoline prices may still push $4 this week.
Bonds React to Rising Rates
Government bonds worldwide are feeling the pressure. The U.K. 10‑year gilt briefly rose above 5%, a level not seen since mid‑2008. Central banks in the U.K. and Eurozone are expected to keep tightening, sending shockwaves through all asset classes.
Gold Takes a Sharp Dive
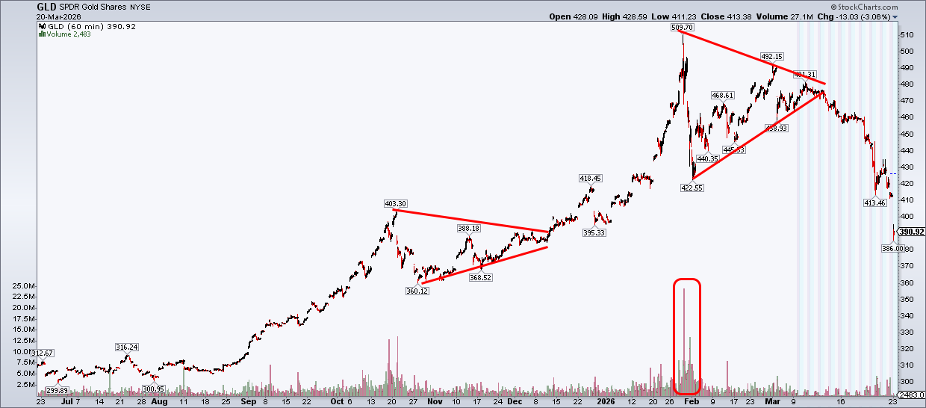
Higher rates also hurt gold. The SPDR Gold Shares ETF fell from $460 in mid‑March to a 16% drop by the end of the month. The metal is acting like a risk‑on asset, selling off as investors flee to higher‑yielding bonds.
Bottom Line
Inter‑market stress is rising as the conflict in Iran continues, though recent political moves have calmed things a bit. Traders are watching the 6,300‑level correction for the S&P 500 and 6,700 as a potential upside barrier. Bonds are in turmoil, gold is under pressure, and even defensive sectors are feeling the squeeze.
Overall, the broad market behavior looks more like the later stages of a classic risk‑off cycle than the early stages of a rally.
Disclaimer: This article is for educational purposes only and does not constitute financial advice.
Source: Materials provided by https://articles.stockcharts.com.Note: Content may be edited for style and length.