
Oil is back in the news. A sharp rise caused by political trouble and supply cuts has made investors wonder how long high prices will last.
Most forecasts expect prices to ease later, but many signs point to a higher price floor at least until mid‑2026.
Geopolitical Risks Keep Oil Up
The biggest driver right now is unrest in the Middle East, especially around Iran and the Strait of Hormuz. This narrow waterway moves about 20% of the world’s oil.
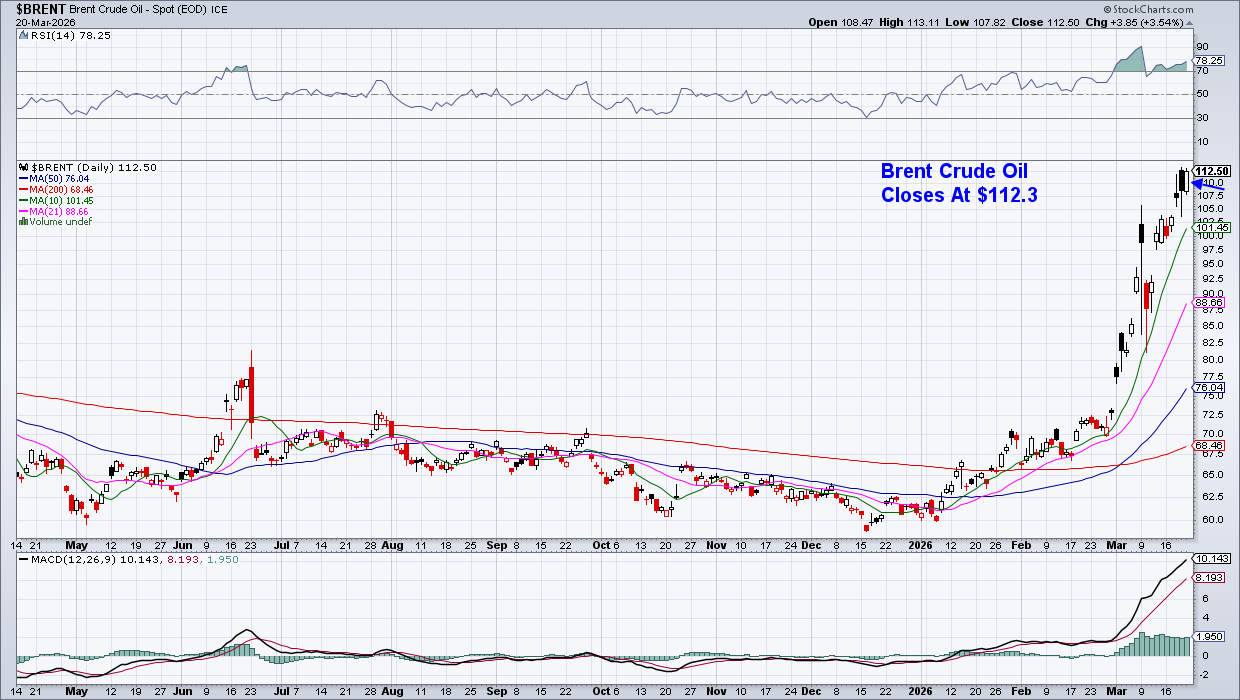
When trouble hits, oil quickly jumps above $100 a barrel, one of the biggest spikes since the 2022 energy shock.
Even short‑term disruptions leave a price premium. Markets may pull back from panic levels, but they rarely fall back to pre‑crisis prices quickly while tensions stay.
Supply constraints like aging pipelines and low investment in alternatives keep the market tighter than simple models predict.
Higher oil costs affect many stocks. Utilities, transport, industrial and consumer companies see tighter profit margins as fuel costs rise.
Sticky inflation from pricey energy also pushes interest rates higher, which can hurt tech stocks. Energy firms, however, often benefit, and some AI‑related and industrial stocks are still holding strong.
Energy spikes also raise market volatility. Past episodes show sharp equity drops, but they usually recover quickly unless the shock triggers a deeper slowdown.
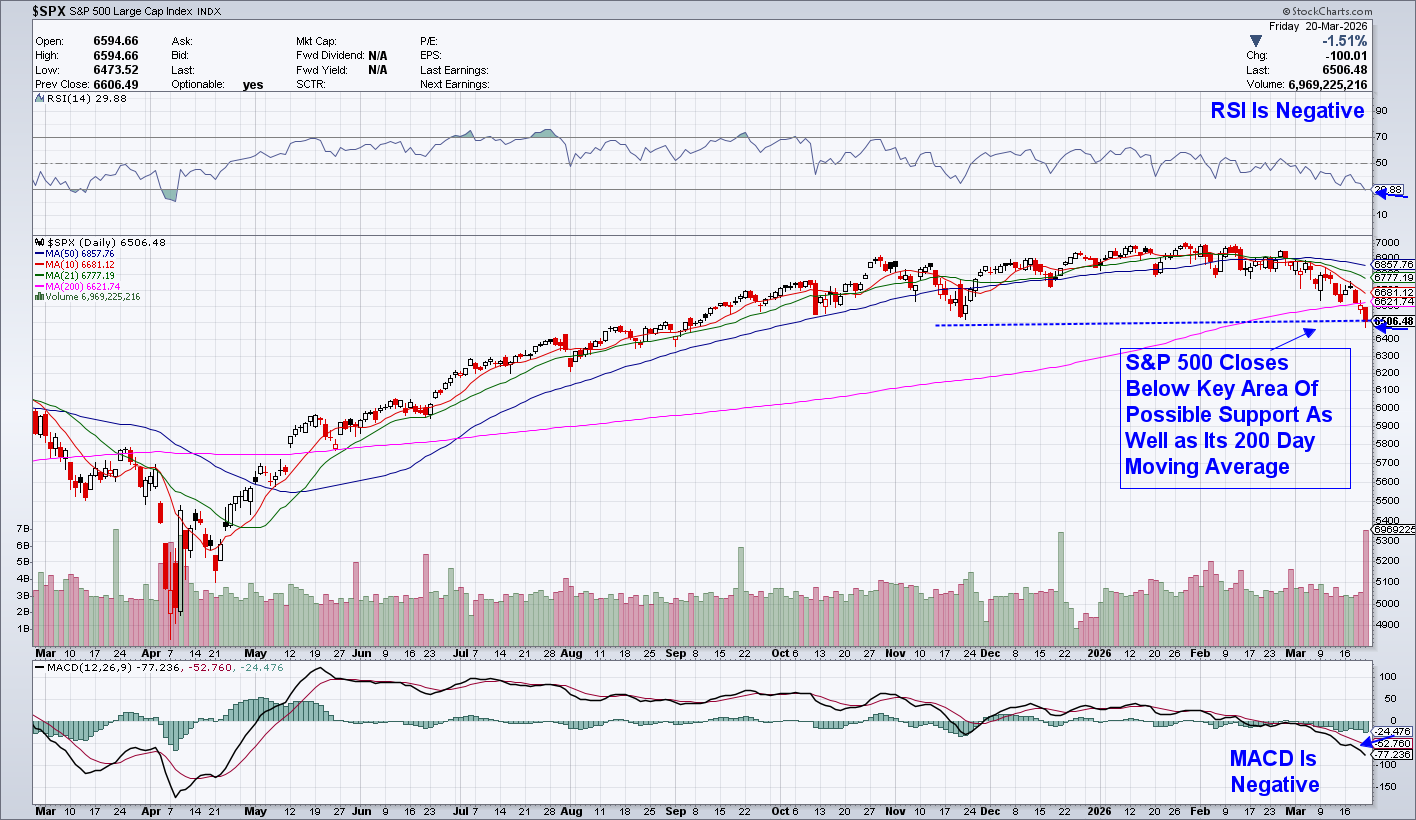
Right now the S&P 500 is trading below a major support line, and ten of its eleven sectors sit under their 50‑day moving averages. The MACD indicator is also in negative territory.
Bottom Line: Higher‑for‑Longer Oil with Spikes
All signs point to oil staying higher for a longer time. Prices seem to have a new floor above $70 a barrel, with occasional spikes caused by politics, steady demand, and a slow return of supply.
Because of these factors, oil is likely to remain elevated through mid‑2026, even if it moves up and down along the way.
Source: Materials provided by https://articles.stockcharts.com.Note: Content may be edited for style and length.