

Before we begin…
In the last article we saw that an index can keep climbing even when fewer stocks are doing the work. The Bullish Percent Index (BPI) shows how many stocks in an index have a Point‑and‑Figure (P&F) buy signal. It tells you if the market is gaining strength or losing steam.
What Makes BPI Different?
Many breadth tools count advancing versus declining stocks or look at moving averages. BPI does something special: it counts actual buy and sell signals on a P&F chart. The result is a simple percentage of stocks that are on a buy signal.
How BPI Is Calculated
Each stock in the index is either on a P&F buy or sell signal. The BPI equals the percent of stocks with a buy signal. A reversal needs a three‑box move, which helps filter out noise.
- Buy signal = X column on the P&F chart.
- Sell signal = O column.
- BPI = (Number of X‑stocks ÷ Total stocks) × 100.
The Six BPI Market Regimes
The BPI acts like a health monitor for the market. It shows six different states, each answering three questions: what’s happening inside, what could you do next, and what mistakes to avoid.
General Rule: BPI > 50% = Bullish, BPI < 50% = Bearish
1. Bull Alert – Possible Bottom
Rule: BPI falls below 30% and then a new X column appears.
What’s happening? Fewer stocks are falling, and the decline may be running out of steam.
What to consider? Look for a leading stock that might start to rise. If you buy, add a little at a time.
Common pitfall: Don’t assume the bottom is already there. The alert only shows a possibility.
2. Bear Alert – Possible Top
Rule: BPI climbs above 70% and then a new O column drops below 70%.
What’s happening? Prices may still rise, but fewer stocks are joining the rally.
What to consider? Tighten stops on long positions, take some profit, and stay ready for a pull‑back.
Common pitfall: Ignoring weakening participation just because the index is still higher.
3. Bull Confirmed – Market in Power Mode
Rule: BPI is on an X column (buy signal).
What’s happening? More stocks are showing buy signals. Strength is broad, not just a few big names.
What to consider? Look for pull‑backs and strong breakouts. Let winners run.
Common pitfall: Selling too early because the market feels “overbought.”
4. Bear Confirmed – Broad Weakness
Rule: BPI is on an O column (sell signal).
What’s happening? Many stocks are on sell signals. The downtrend is spreading.
What to consider? Reduce risk, tighten stops, or look for short opportunities.
Common pitfall: Trying to catch a bottom too early.
5. Bull Correction – Pull‑back in a Strong Market
Rule: BPI stays on a buy signal but the column is falling (O column).
What’s happening? Participation cools, but the overall uptrend stays alive.
What to consider? Buy the dip in solid stocks.
Common pitfall: Panic selling during a normal pull‑back.
6. Bear Correction – Bounce in a Weak Market
Rule: BPI stays on a sell signal but the column is rising (X column).
What’s happening? Some stocks bounce, but the broader trend is still down.
What to consider? Use the bounce for exits or short entries.
Common pitfall: Mistaking the bounce for a new bull market.
Real‑World Example: Tech Sector BPI vs. XLK
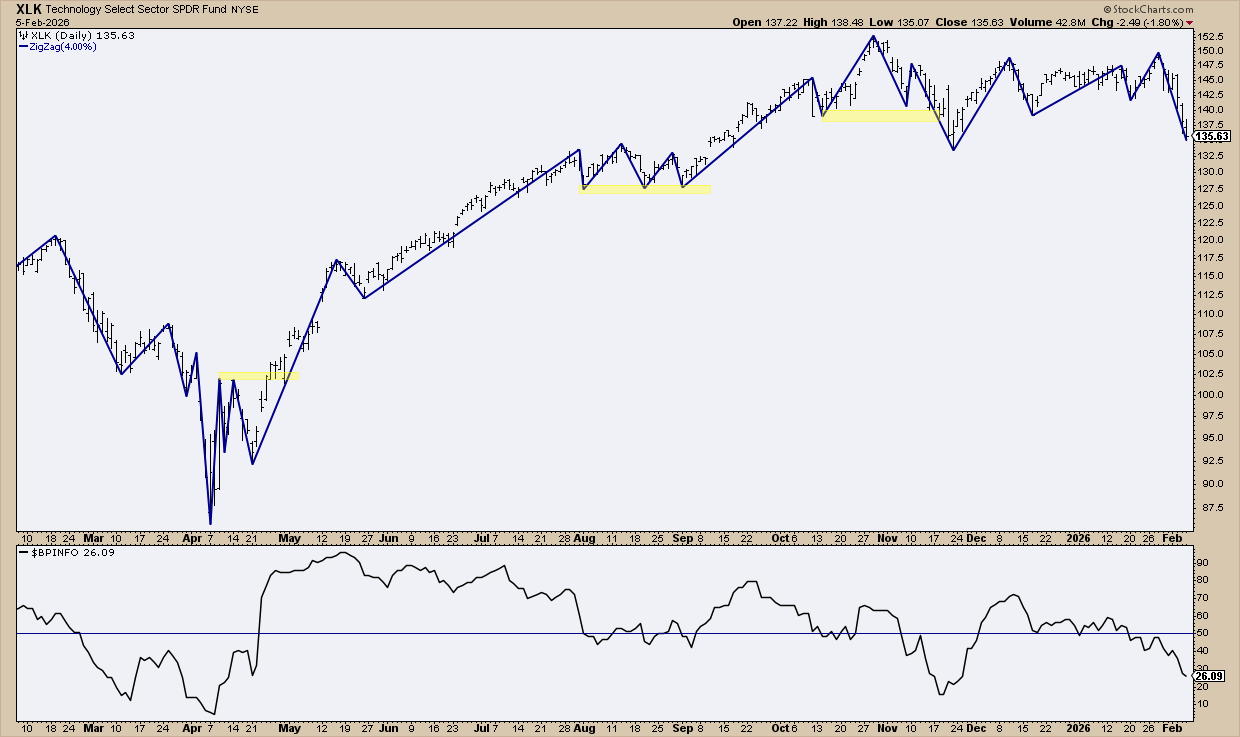
In early 2025 the tech BPI gave a bull alert as the sector hit a low on April 7. After the price broke a recent swing high, the BPI rose above 50% and later climbed past 70%, confirming strong participation. Over the next months the BPI slipped back below 50% while the price moved sideways, showing a divergence.
Notice the yellow shaded zones. Even when BPI warns of a shift, price action still needs to confirm the move.
Common BPI Mistakes
Do not sell just because BPI looks “overbought,” and do not buy just because it looks “oversold.” Combine BPI with other tools and always check the chart’s structure.
Remember the six regimes. Context matters more than a single number.
Insider Tips
Tip #1 – Set Your Bias with BPI. Start by checking the BPI. If it is above 50%, think bullish. Below 50%? Consider defensive moves. Then verify with the price chart.
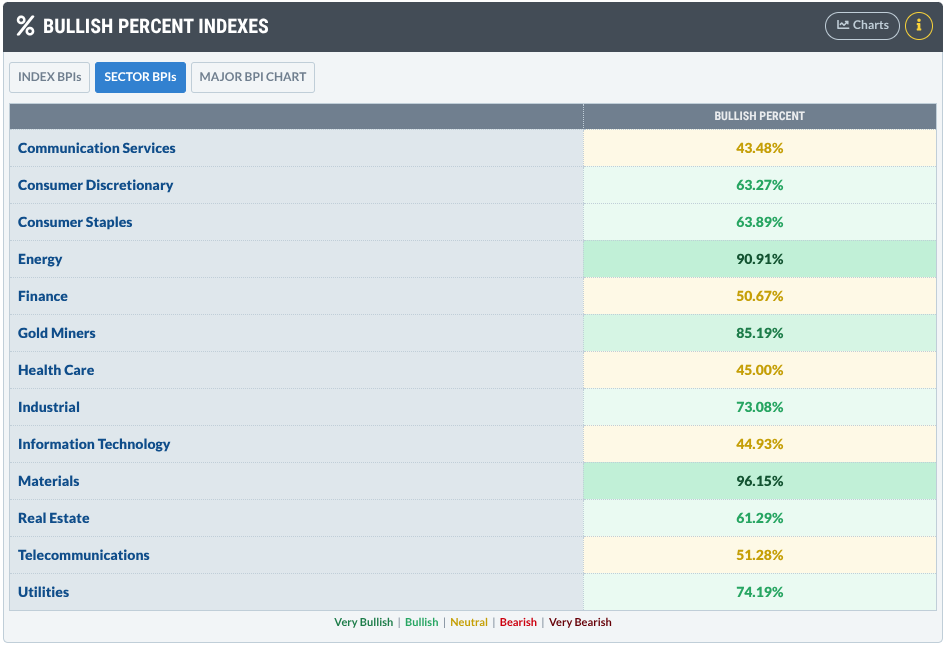
Tip #2 – Spot Sector Rotation Early. Compare sector BPI lines. When one climbs while another falls, money may be moving between sectors before news catches up.
Tip #3 – Look for Hidden Divergences. If the S&P 500 BPI is rising but the Nasdaq BPI is falling, leadership may be narrowing, warning that the rally could lose steam.
Final Thoughts
The Bullish Percent Index is the only breadth tool that uses Point‑and‑Figure signals. That makes it special. Use it with other indicators to see inside shifts before they appear in the price. Doing so can give you an edge in timing entries and exits.
Source: Materials provided by https://articles.stockcharts.com.Note: Content may be edited for style and length.