
CAC 40 Ends Day Slightly Higher
The French CAC 40 index finished the session up 0.18%, closing at 8,057.36 points with an average volume of €6.289 billion.
The Paris market kept the technical rebound that started yesterday. The rise comes after a sharp correction that shook the CAC 40 last week, especially at the beginning of the week, when Middle‑East tensions and high oil prices added pressure.
Investors are still cautious because the global situation remains uncertain. A brief calm appeared on Monday evening when former U.S. President Donald Trump suggested the Iran conflict could end quickly. That comment helped ease worries for a short time, but most analysts still warn that geopolitics stay fragile.
Oil prices also softened. Brent crude settled around $90 after dropping more than 10% overnight, following Trump’s remarks about a possible end to the war and the easing of some oil sanctions.
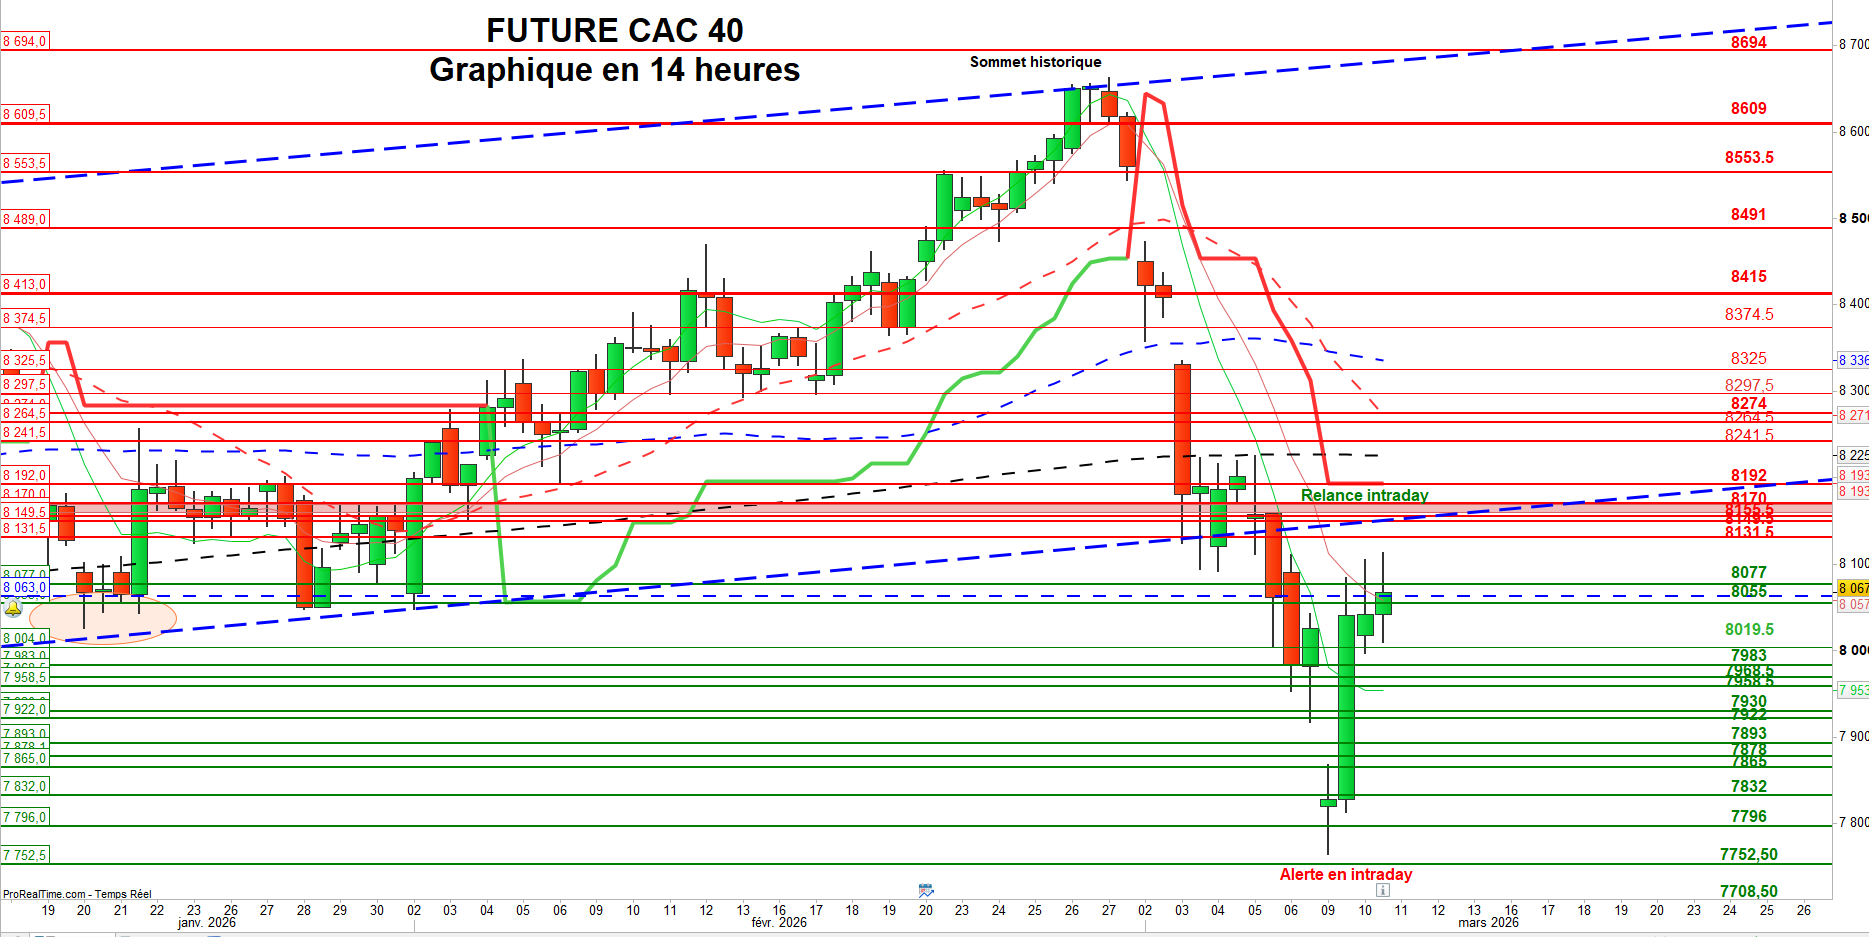
Key Levels for the CAC 40 Futures
Resistance (price ceilings):
- 8,131 – 8,170
- 8,192 – 8,241
- 8,274 – 8,325
- 8,415 – 8,551
- 8,632 – 8,810 – 8,910
Support (price floors):
- 8,055 – 8,019 – 7,991.5
- 7,873 – 7,853
- 7,831 – 7,740.5
- 7,615.5
During the trading day, the market shows a bullish tilt as long as it stays above 7,904 points.
What the Chart Is Saying
After a tough start to the week, buyers managed to close a exhaustion gap and push the index above 7,900 points. Keeping the weekly close above that level is now important.
The next steps are to:
- Re‑enter the long‑term up‑trend channel by breaking the 8,130‑8,170 zone.
- Fill the March 3 “continuation gap” (8,298.31 – 8,378.18).
- Close the March 2 “breakaway gap” (8,461.75 – 8,553.94) to move toward the historic high of 8,642.23.
Technical indicators support the upside: the MACD histogram has turned positive, the RSI follows the same direction, and trading volumes stay strong, especially during pull‑backs.
Risks to Watch
If the index slips below 7,980 points, the current bounce could lose momentum. Dropping under the middle of the large bullish candle from March 9 (the “marubozu” at 7,948 points) would give sellers an advantage and test the 7,900‑point level again.
As long as the weekly close stays above 7,900, the medium‑term bullish bias remains intact.
Final Thoughts
Last week’s series of gaps can be classified as:
- Breakaway gap
- Continuation gap
- Exhaustion gap – usually appears at the end of a move and can signal a technical rebound.
We are using this calm phase to gradually strengthen the “Dynamic” and “Investor” portfolios, which were trimmed before the recent correction. The goal is to reposition carefully while keeping an eye on upcoming technical levels.