


Why Cisco Might Lose Money
Investors have been hoping that inflation will drop and the Fed will cut rates. Recent world events have changed that picture. Oil prices are climbing, and the labor market is cooling down. This mix can cause a situation called stagflation – high prices and low growth at the same time. In that case, the Fed is stuck: cutting rates could make inflation worse.
If borrowing stays expensive and growth slows, company leaders will try to save cash. Their first move is often to cut big‑ticket spending, especially on large IT projects.
Cisco (CSCO) depends on big corporate IT upgrades to sell its networking gear. With companies pausing those upgrades, Cisco faces a serious drop in demand.
What the Charts Are Saying
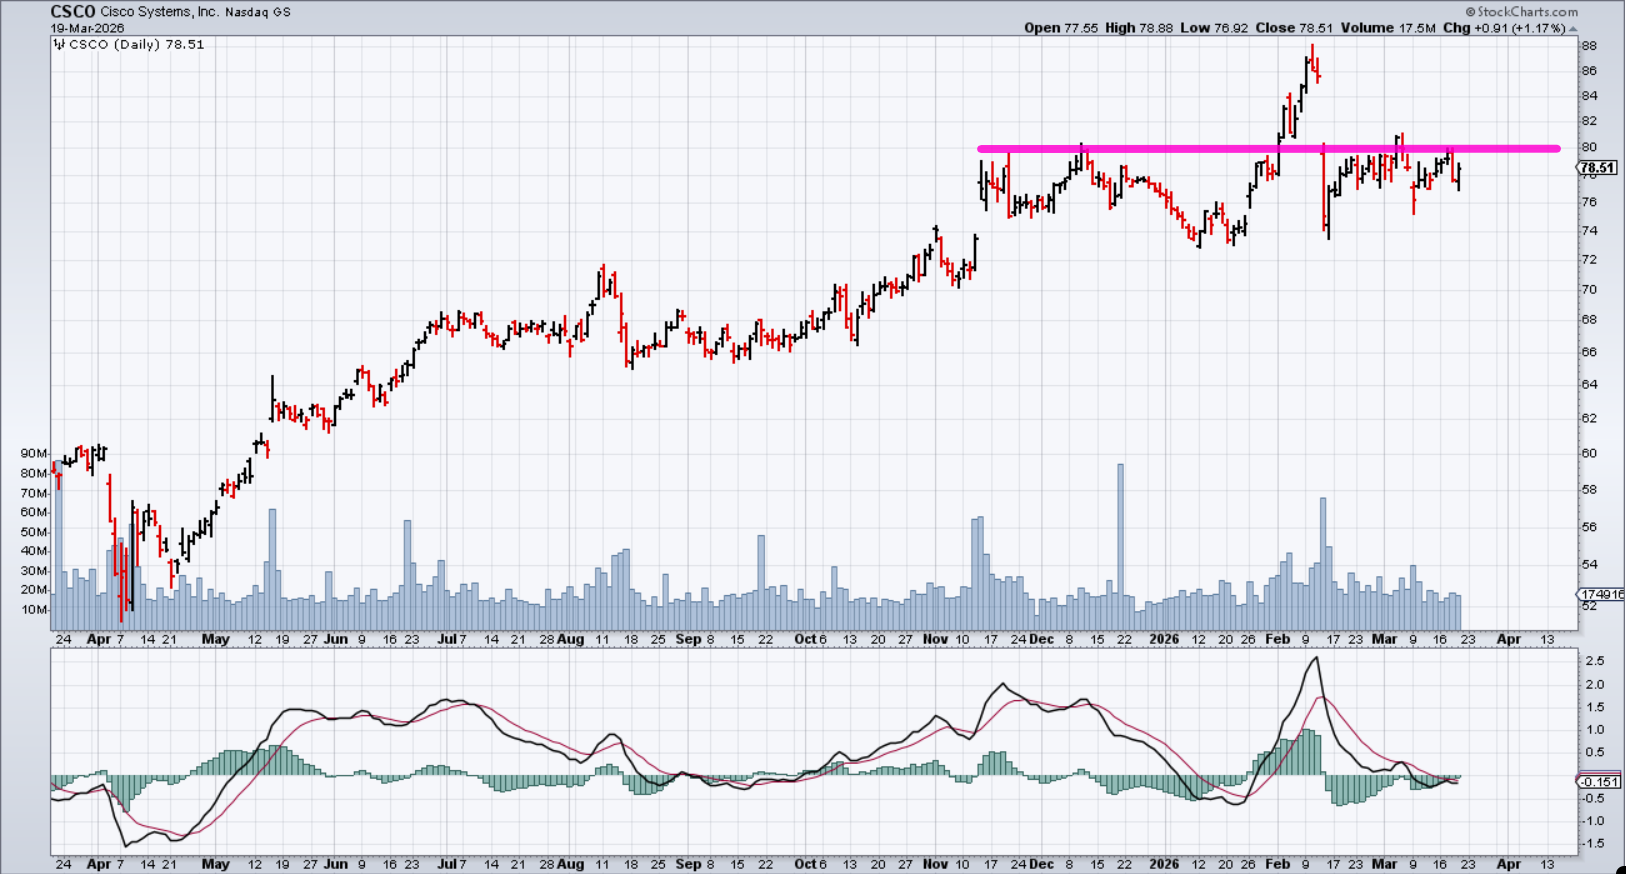
After climbing for many months, Cisco’s stock hit a ceiling just below $90. It then fell sharply, breaking through short‑term moving averages and sliding to around $78.50. Momentum indicators now show strong negative signals, suggesting the down‑trend is gaining strength.
Simple Option Trade: Bear Put Spread
In a market that can swing wildly, we want to profit from a fall without the unlimited risk of short‑selling. A bear put spread does exactly that: we buy a higher‑strike put and sell a lower‑strike put.
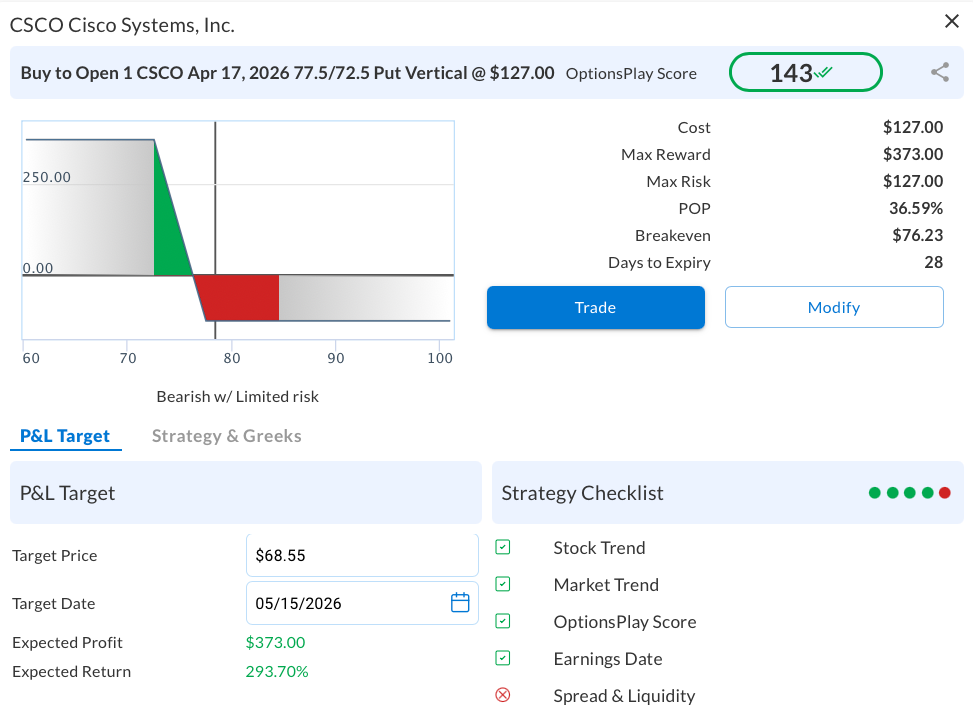
- Strategy: Aggressive Bear Put Spread
- Expiry: April 17, 2026 (28 days)
- Legs: Buy $77.50 put, sell $72.50 put
- Net cost: About $1.25 per share ($125 per contract)
- Breakeven: $76.25 (roughly 2.9% below current price)
By selling the $72.50 put, we fund most of the purchase price of the $77.50 put. The total risk is only $125 per contract, while the maximum profit could reach $375 – a 3‑to‑1 reward‑to‑risk ratio. If Cisco drops just under 3%, we break even; a fall toward $72 could give the full payoff.
Finding a Trade Like This in Seconds
Old‑school research might look like this:
- Scan for bearish breakdowns – 50‑100 stocks
- Check fundamentals – narrow to 10‑15
- Review options chains – confirm liquidity
- Build spreads – calculate risk/reward
- Pick the best – 1‑2 hours total
Using an options‑analysis tool, the same process takes about five seconds:
- Select “Bearish Trend Following” scan
- Choose “Bear Put Spread” strategy
- Set timeframe to 30 days, risk to aggressive
- Click “Update” – CSCO appears with a top score
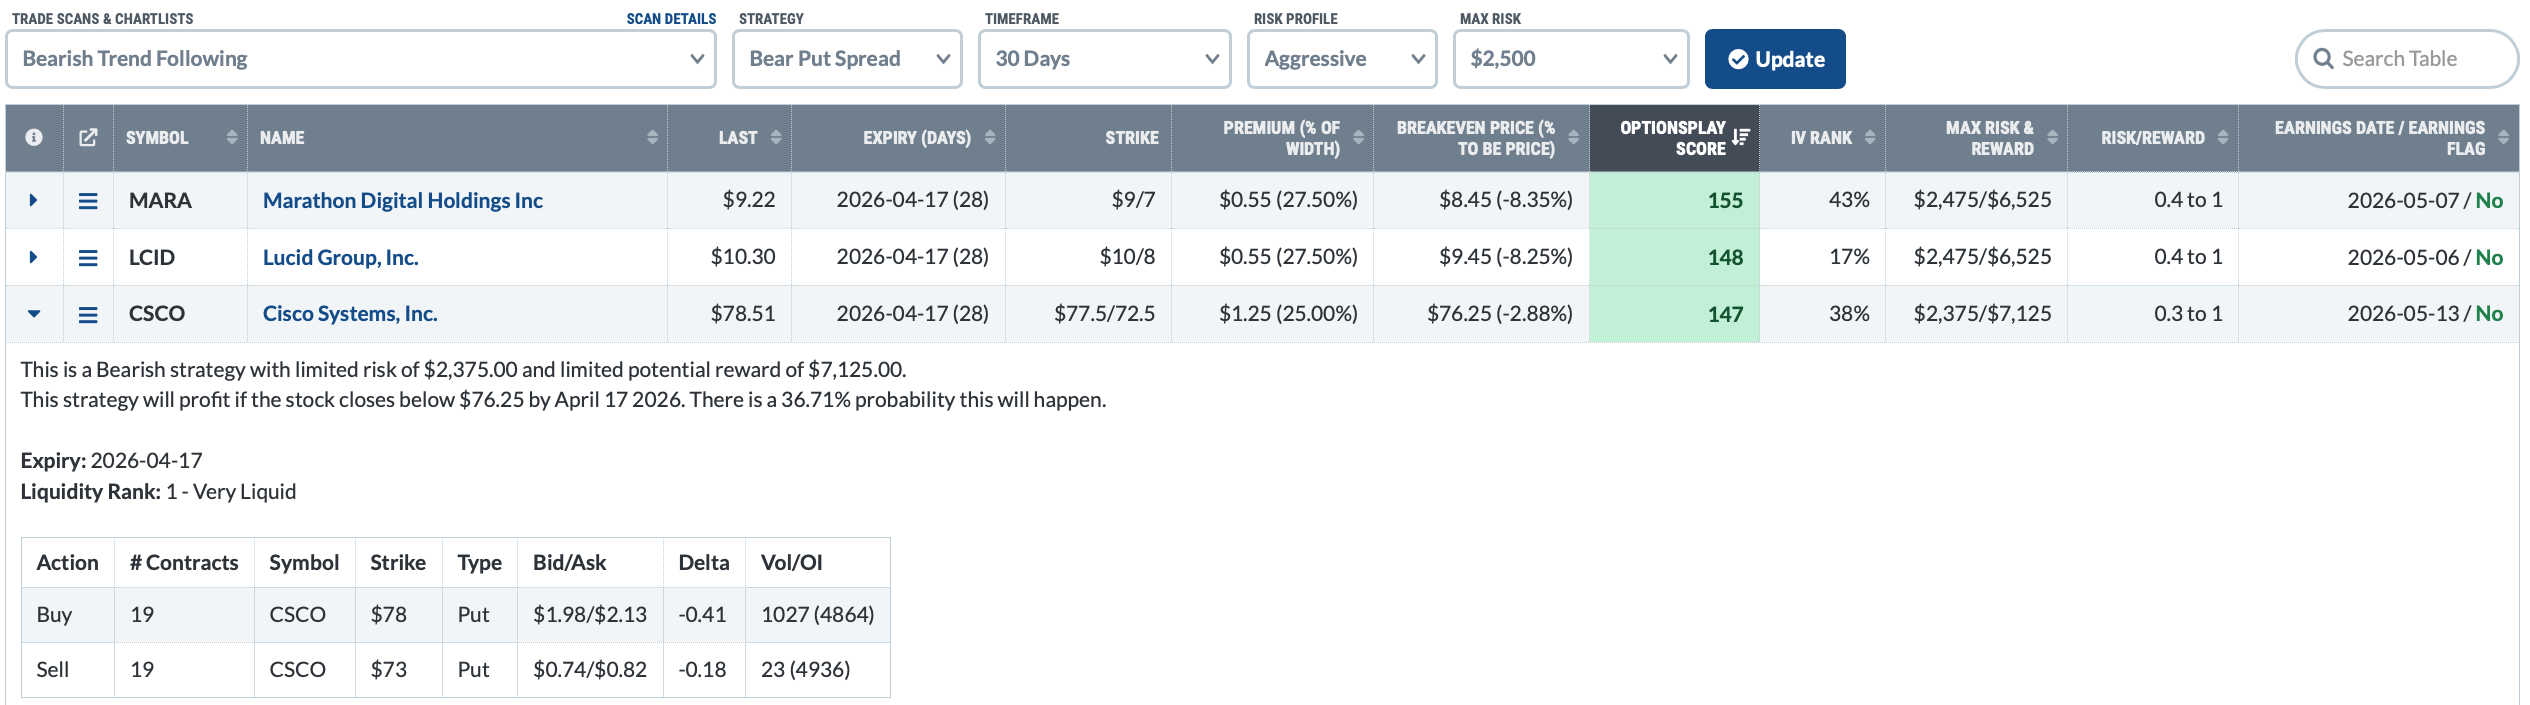
The scanner automatically filters stocks that have bearish chart signals, liquid options, and strikes that match current volatility. This way, you start with the best option opportunities and then confirm the underlying thesis.
Source: Materials provided by https://articles.stockcharts.com.Note: Content may be edited for style and length.