
SPY is at a crucial point. The 5‑day moving average is getting very close to the 200‑day line. If the short line falls below the long one, the market could turn down.

Why the Moving Averages Matter
The SPDR S&P 500 ETF (SPY) shows a tiny gap of only 0.70% above its 200‑day average. A cross under the long line would be a bearish signal for the most watched U.S. stock index.
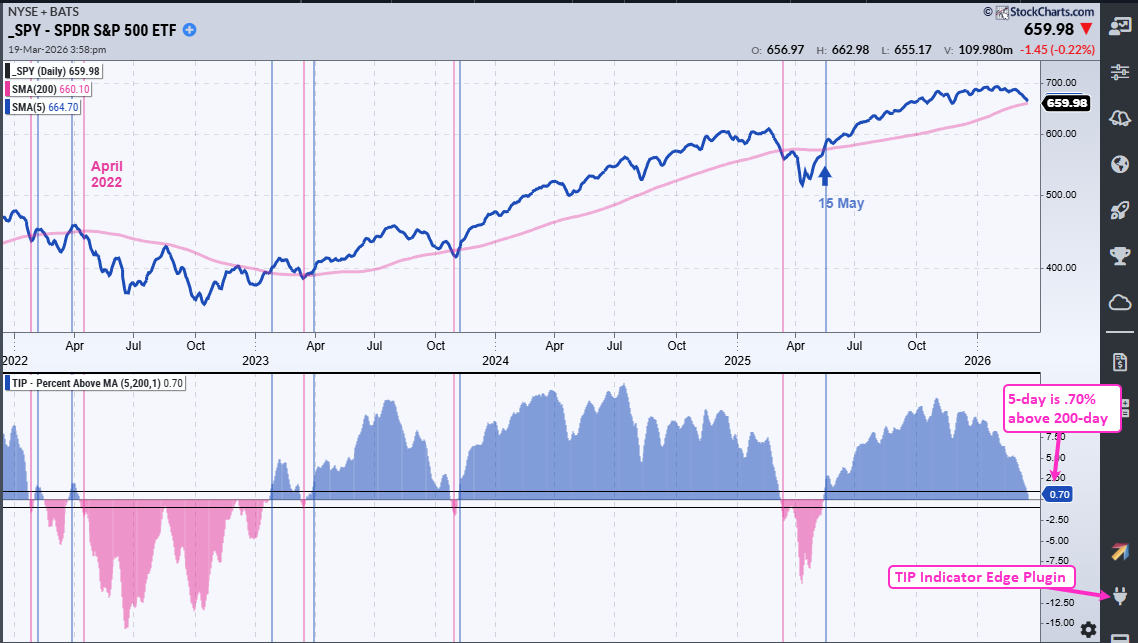
Traders use the "Percent Above MA" indicator to see how far the short‑term average is from the long‑term one. A move larger than 1% usually triggers a clear signal and helps avoid false alerts.
More Stocks Falling Below Their Long‑Term Averages
Both the S&P 500 and Nasdaq 100 have fewer stocks above the 200‑day line. The percentages are under 50% and are the lowest since May.
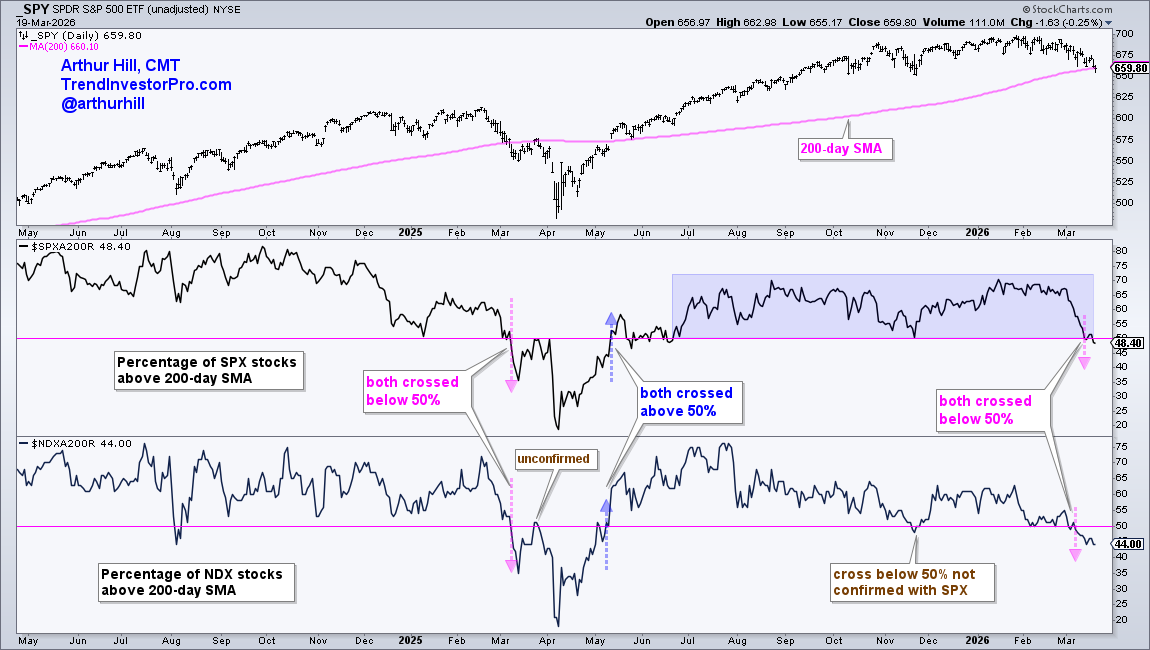
The Nasdaq crossed above the 50% mark on May 8 and stayed there. The S&P followed on May 12, confirming a brief bullish phase. A drop below 50% on March 6 started a new bearish signal that is still active.
Credit Market Stress Shows Up in Yield Spreads
The BBB corporate‑bond spread widened sharply in March, reaching its highest level since May. A widening spread means investors demand more return because they see higher risk.
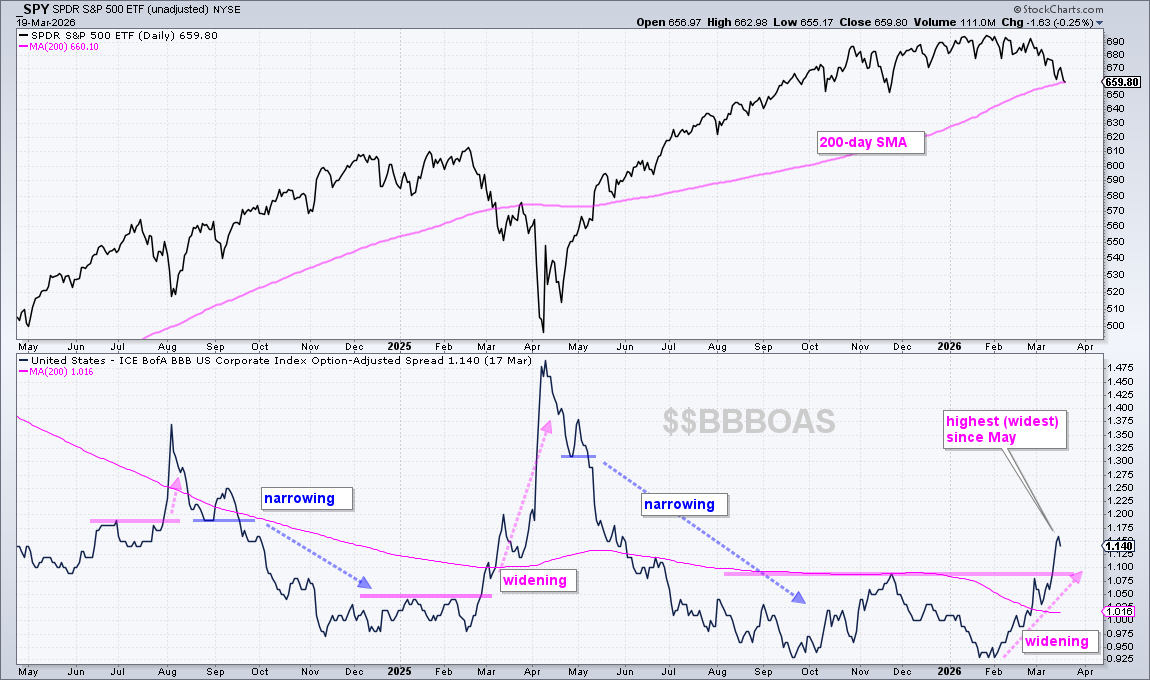
When the spread gets big, it often signals trouble for stocks. The recent widening began in late February and grew in March as the S&P 500 fell below its 200‑day line.
In simple terms, a narrow spread shows confidence, while a wide spread shows stress. Keeping an eye on these spreads helps traders understand where the market might head next.
Source: Materials provided by https://articles.stockcharts.com.Note: Content may be edited for style and length.