

Markets stayed under pressure all week, moving clearly lower. The Nifty swung a wide 994‑point range, from 23,465.35 down to 22,471.25, and finished near the lower edge. Volatility jumped as the India VIX added about 17.5% for the week, showing more uncertainty. Even with the pull‑back, Indian stocks still beat many weaker global markets. The Nifty closed down 294.90 points, a 1.28% loss.
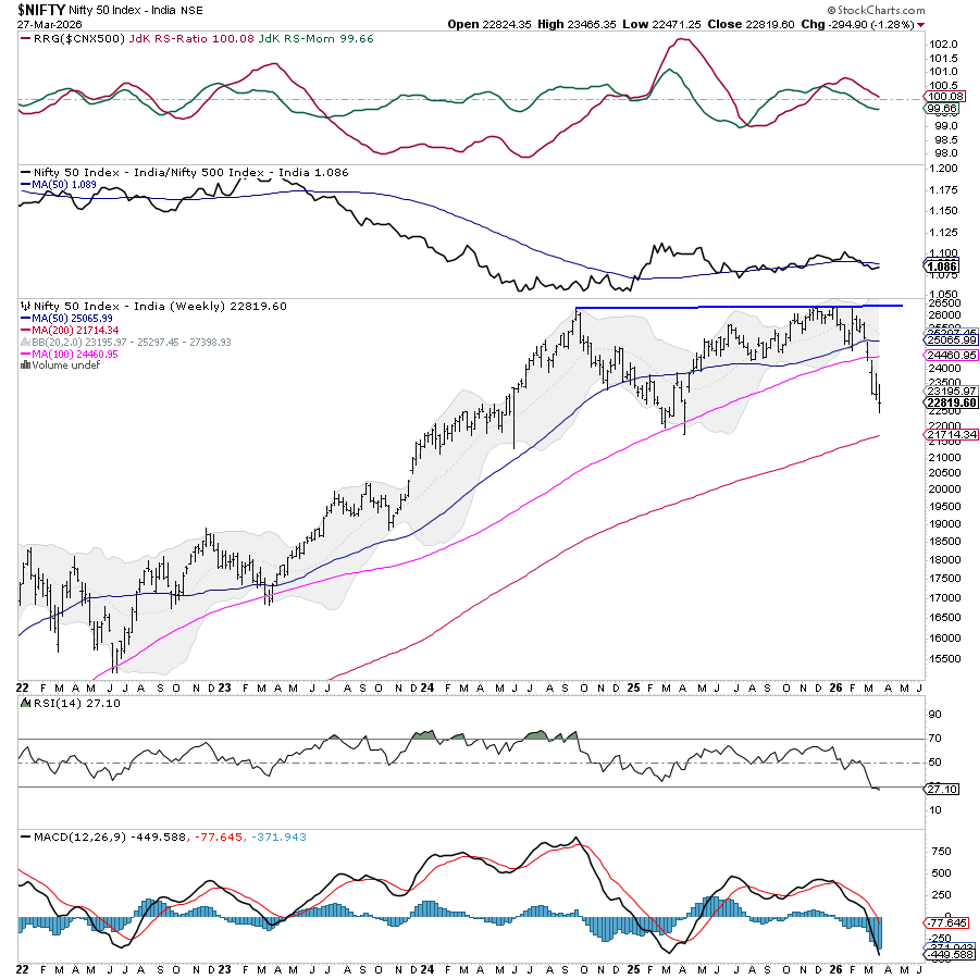
From a structural view, the Nifty broke short‑term support and fell below important levels. It now trades under its 50‑week and 100‑week moving averages and is close to a key support band. This suggests the market may move from a flat phase into a longer correction. With higher volatility and weaker prices, the market could drop further unless it quickly regains lost ground. Any bounce toward previous resistance is likely to meet selling pressure, while staying below near‑term supports could start a bigger decline.
Because the trading week is short, expect a careful start with occasional spikes of volatility. Immediate resistance sits at 23,150 and 23,450; support is found at 22,450 and 21,700.
The weekly RSI reads 27.11, placing it in oversold territory. It made a 14‑day low but shows no clear bullish sign against price, so weakness remains. The MACD stays bearish, below its signal line, indicating negative momentum. A strong bearish candle on the weekly chart adds to the down pressure.
The index is now below its short‑to‑medium moving averages. The long‑term 200‑week average around 21,700 acts as a crucial support level. Failure to stay above earlier breakout zones points to selling at higher prices, and upper resistance levels have also been pushed lower.
Given this picture, a careful and defensive stance is wise for the next week. Traders should skip aggressive long bets and focus on protecting capital. Any small bounce should be used to trim positions, not to start new ones. Choose a few strong stocks, apply tight risk limits, and watch volatility closely.
Sector Analysis for the Coming Week
Using Relative Rotation Graphs (RRG), we compared many sectors to the CNX500 (NIFTY 500) index, which represents more than 95% of the market’s free‑float cap.
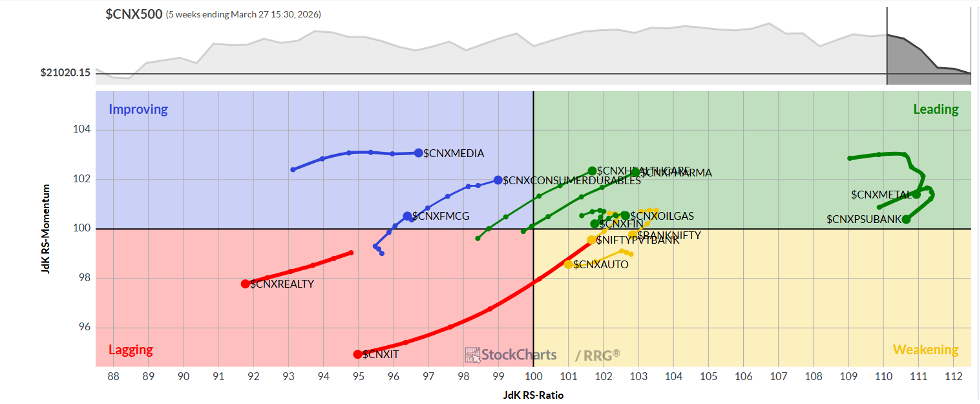
The RRG shows that the PSE, Pharma, Energy, and Infrastructure sectors sit in the leading quadrant, meaning they may beat the broad market. Metal, PSU, and Financial Services also appear there, though they are losing some momentum.
The Nifty Bank index moved into the weakening quadrant, as did Auto and Midcap 100, although Midcap 100 shows signs of improving.
The Services sector fell into the lagging quadrant, and both Realty and IT are also lagging, likely underperforming the NIFTY 500. Media and FMCG sit in the improving quadrant.
RRG charts illustrate relative strength and momentum; they are not direct buy or sell signals.
Source: Materials provided by https://articles.stockcharts.com.Note: Content may be edited for style and length.