

The market stayed under pressure all week. The Nifty moved a lot, covering a range of about 863 points. Volatility jumped, with the India VIX rising almost 19% to 14.46. By week’s end the index was down 718 points, a loss of roughly 3.1%.
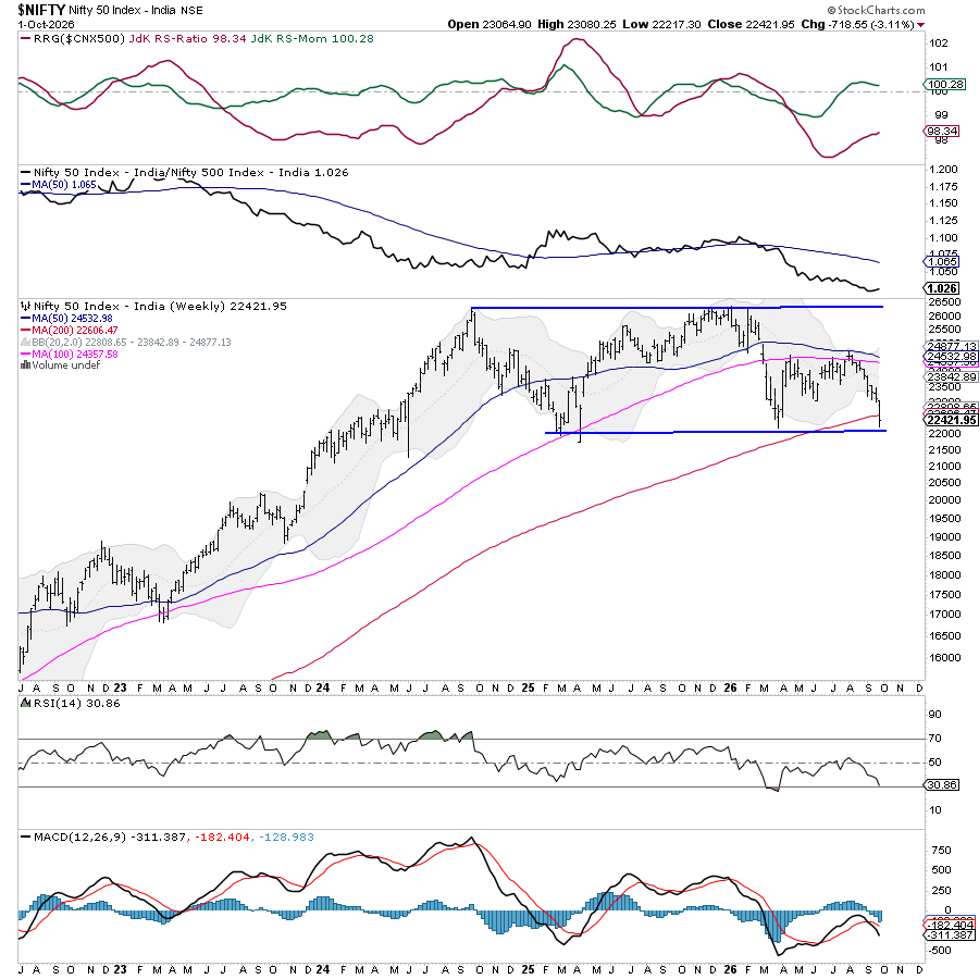
Technically, the Nifty looks weaker now. It has just slipped under its 200‑week moving average, which sits at about 22,607. This is the first time the index has fallen below that long‑term line since March 2020. The 22,600 area will be important in the coming days. If the index climbs back above the 200‑week line soon, the technical picture improves. If it stays below, the downtrend could keep going. The fall looks stretched, so a bounce may be coming.
Trading will restart after a one‑day holiday. The week also includes a key event: the RBI’s Monetary Policy Committee meets from October 5‑7, with the decision announced on October 7. Interest‑rate‑sensitive stocks may stay cautious, and volatility could stay high around the announcement. Key resistance levels are near 22,600 and 22,800, while support sits around 22,200 and 22,000.
The weekly RSI is about 30.9, just above the oversold zone, and there is no price‑RSI divergence. The weekly MACD stays bearish, sitting below its signal line.
Pattern checks show the Nifty testing the lower edge of its broad range while also sitting under the 200‑week line. This makes the 22,200‑22,600 zone a crucial technical battleground. A quick move back above the long‑term average would ease pressure, but a prolonged stay below could lead to a deeper correction.
For the week ahead, a careful, selective approach is best. The near‑oversold setup means new short bets could be hit by a fast bounce. At the same time, the break of the 200‑week line suggests not every rally is a true reversal. With the RBI decision adding extra risk, expect volatility to stay elevated. Keep trades stock‑specific, avoid heavy leverage, and watch how the Nifty behaves around the 200‑week level.
Sector Outlook for the Week
Using Relative Rotation Graphs (RRG), we compared several sectors against the CNX500, which represents more than 95% of the market’s free‑float value.
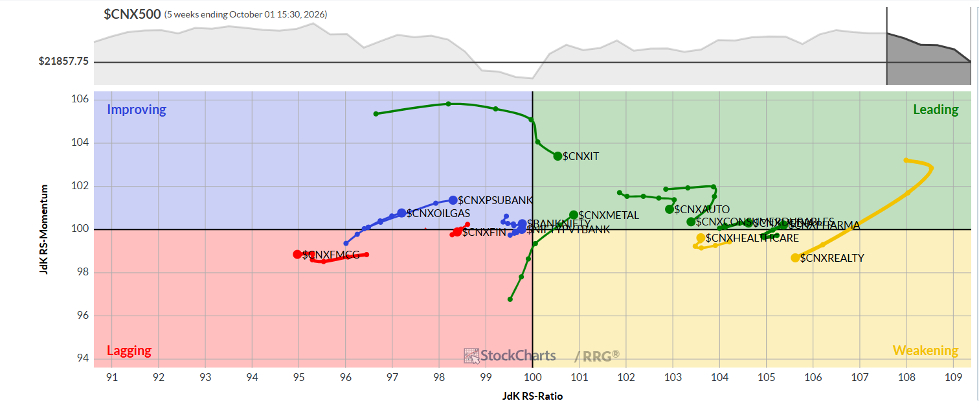
The Pharma index has moved into the leading quadrant, meaning it may beat the broader market. IT, Auto, Metal, and Media indices are also in the leading quadrant and could show relative strength.
The Realty index slipped into the weakening quadrant, as did the Mid‑Cap 100. Individual stocks might still do well, but the overall sector may lag.
The FMCG index is sitting in the lagging quadrant, suggesting it could underperform. Energy, Financial Services, Infrastructure, and PSE indices are also lagging, though they are gaining momentum.
PSU Bank, Services, and Bank indices are in the improving quadrant, indicating a gradual rise in relative performance.
Note: RRG charts display relative strength and momentum of groups of stocks compared to the NIFTY500 benchmark. They are not direct buy or sell signals.
Source: Materials provided by https://articles.stockcharts.com.Note: Content may be edited for style and length.