

Not all mega‑cap growth stocks behave the same way. To keep things simple, I split a dozen of the biggest growth names into three groups: good, okay, and bad. This helps us focus on the most interesting price charts.
In my old buy‑side job, we used a method called "bucketing" to sort stocks by the shapes their charts made. By putting every stock into a bucket, we could spot the strongest technical setups fast.
Below you’ll find an example for each bucket, a short description of the chart pattern, and what would move the stock to a different bucket.
The Good Bucket: NVIDIA (NVDA)
NVIDIA’s price made a new 52‑week high and stays above rising moving averages. The stock also beats the S&P 500, and its momentum is getting stronger.
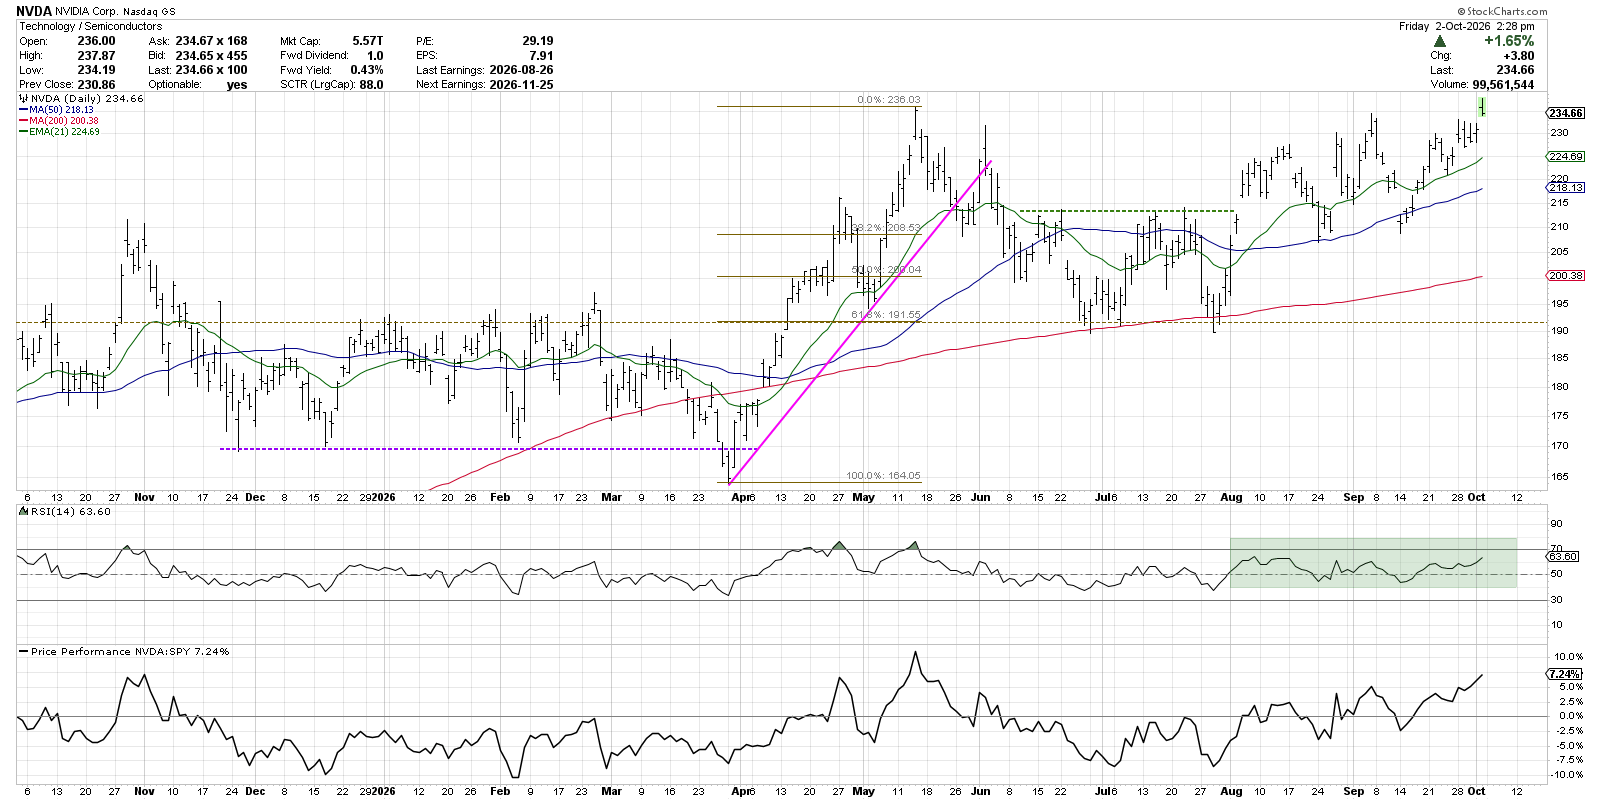
When the price breaks to a fresh swing high, I look for the RSI to climb above 60. So far, NVDA shows a solid uptrend and healthy momentum, which suggests the bullish move could keep going.
The OK Bucket: Alphabet (GOOGL)
Alphabet’s chart is very neutral. Since late July the price has been bouncing between lower highs and higher lows, hovering around $345. The RSI stays between 40 and 60, showing no clear direction.
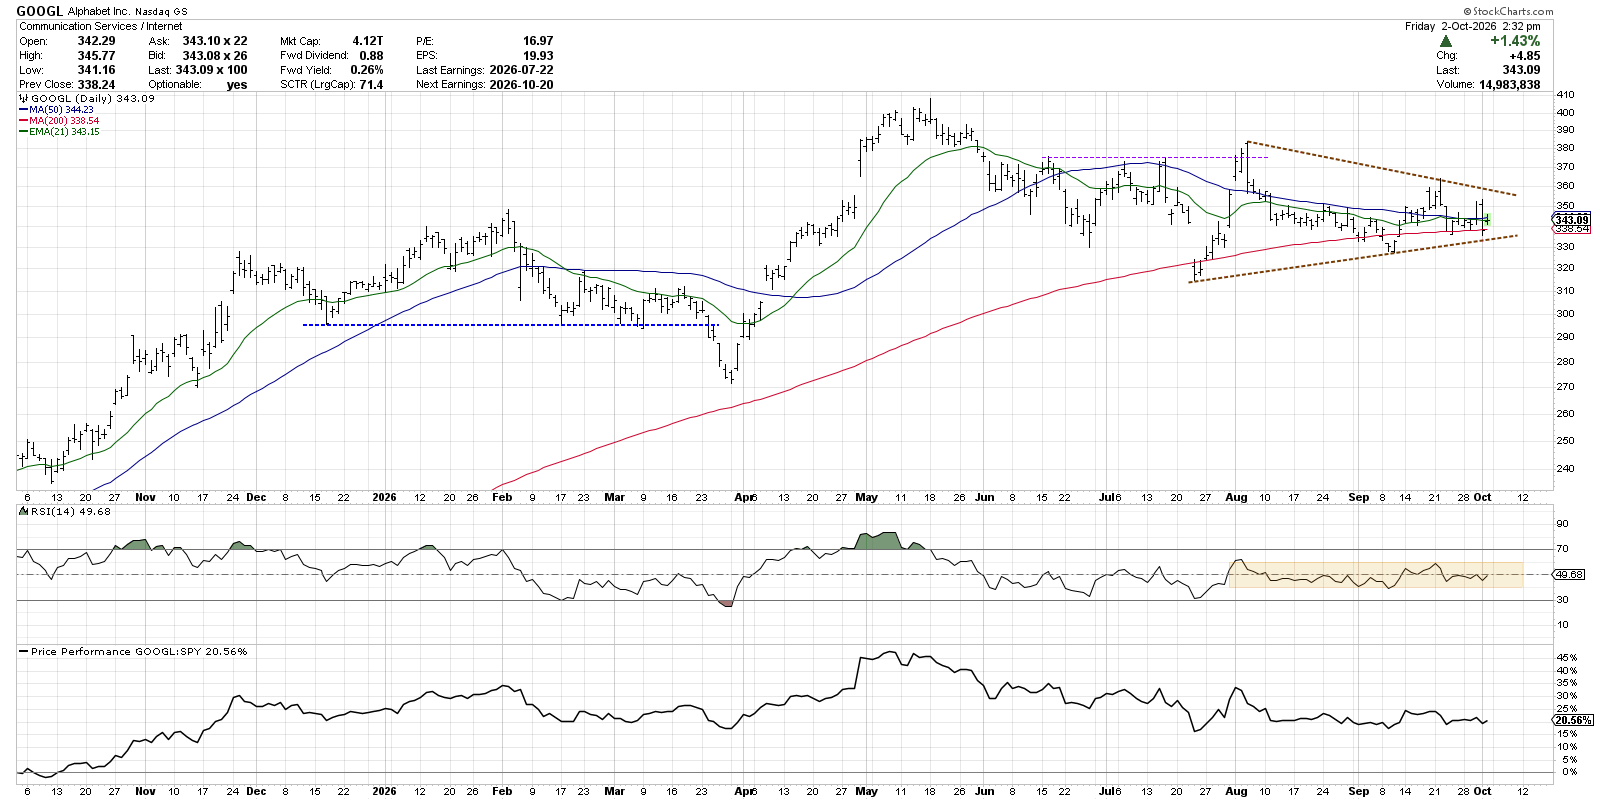
The stock is holding its 200‑day moving average, but all signs point to a sideways market. A clear breakout and a jump in momentum would be needed before we move it out of the OK bucket.
The Bad Bucket: Broadcom (AVGO)
Broadcom looks weak. Its moving averages are pointing down, the RSI stays in bearish territory, and the stock has lagged the market badly.
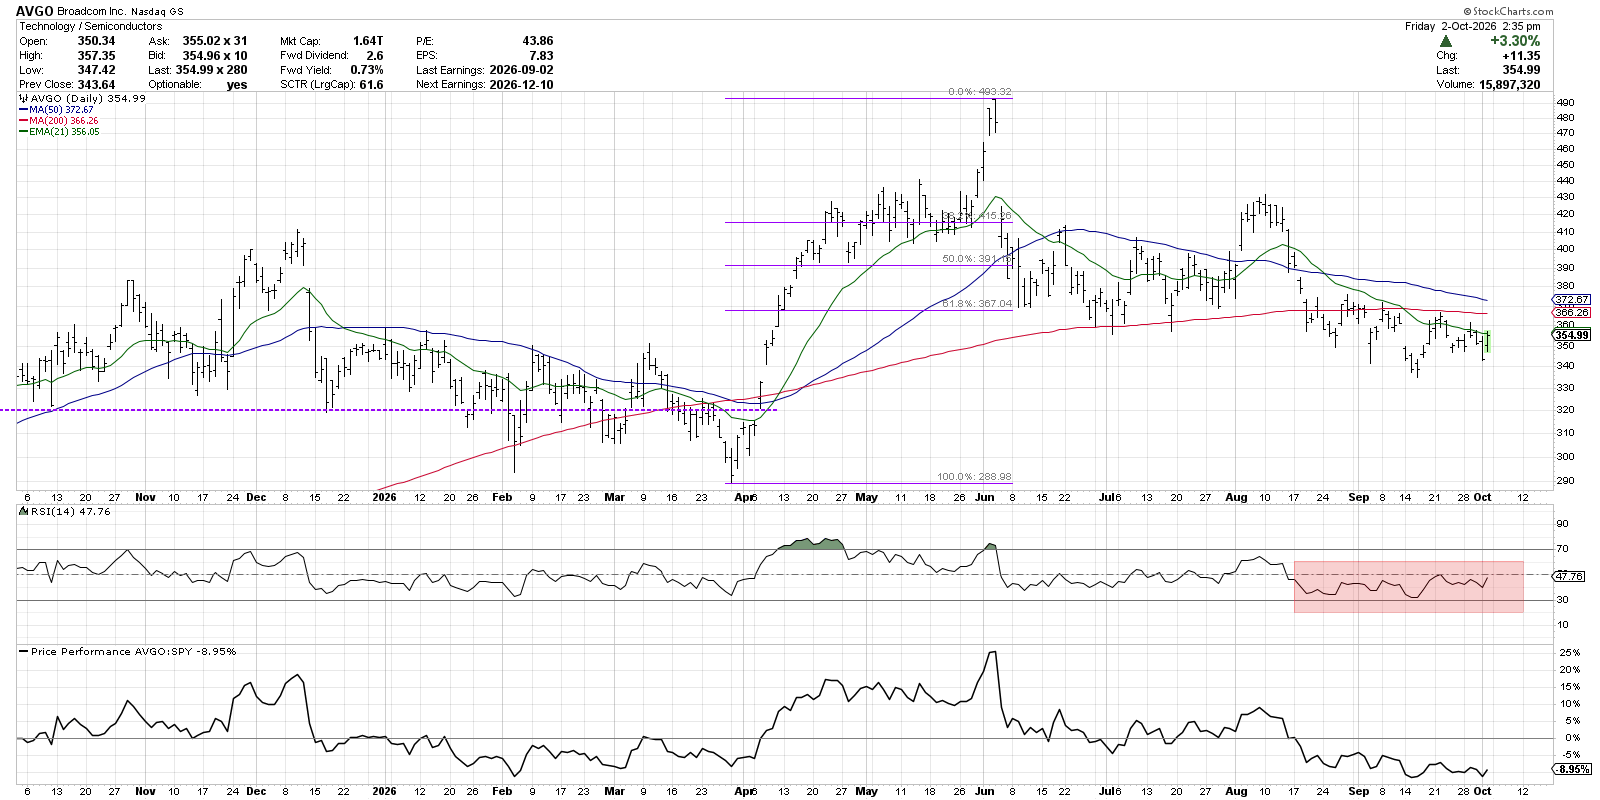
To lift Broadcom out of the bad bucket, the price would need to climb back above key moving‑average support and the RSI should move above 60. Those changes would signal a possible turnaround.
Remember, a stock in the bad bucket isn’t necessarily a loss. It simply tells us to watch for specific signals—like a trend reversal or a momentum boost—before we consider a trade.
Disclaimer: This material is for educational purposes only and does not constitute financial advice. Always consider your personal situation and consult a professional before acting.
Source: Materials provided by https://articles.stockcharts.com.Note: Content may be edited for style and length.