
During the past two weeks the S&P 500 moved only a little. It rose 0.8 % in the first week and fell about 1 % the next, ending with a tiny net loss.
Changes in the Top Five Sectors
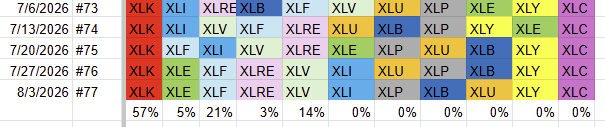
- Technology stayed at the very top.
- Energy jumped from sixth place to number two.
- Financials slipped a spot, moving to third.
- Real Estate moved up one slot, now fourth.
- Health Care fell to fifth.
Movers in the Lower Half
- Industrials fell to sixth.
- Utilities rose to seventh.
- Consumer Staples slid to eighth.
- Materials, Consumer Discretionary and Communication Services stayed at ninth, tenth and eleventh.
Weekly and Daily RRG Summary
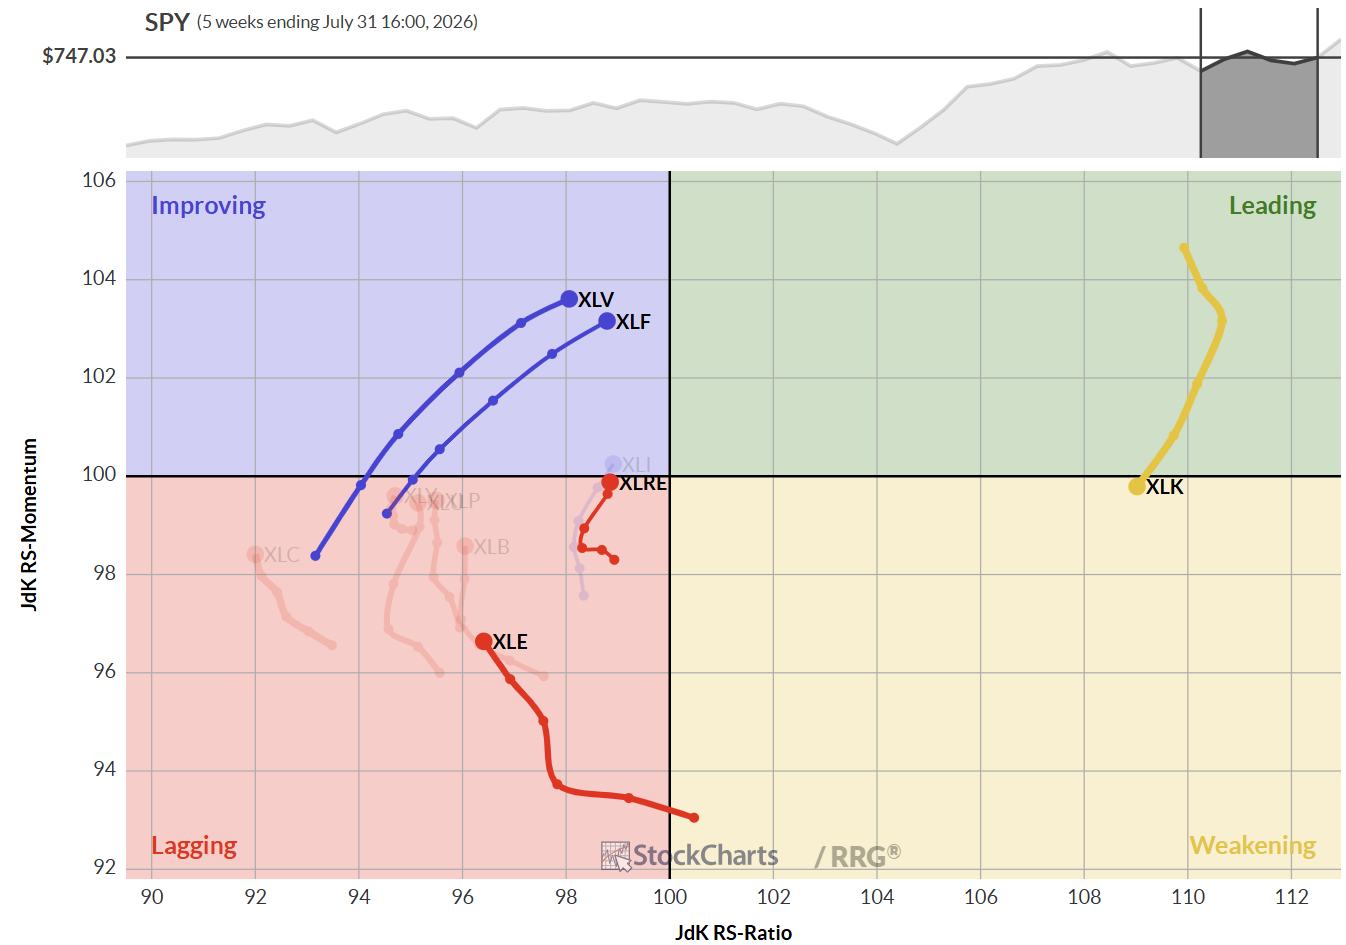
On the weekly chart, Technology is still the only sector in the lagging corner. Health Care and Financials sit in the improving corner and are moving toward the leading area. Real Estate and Energy are still lagging, but Energy is beginning to gain strength.
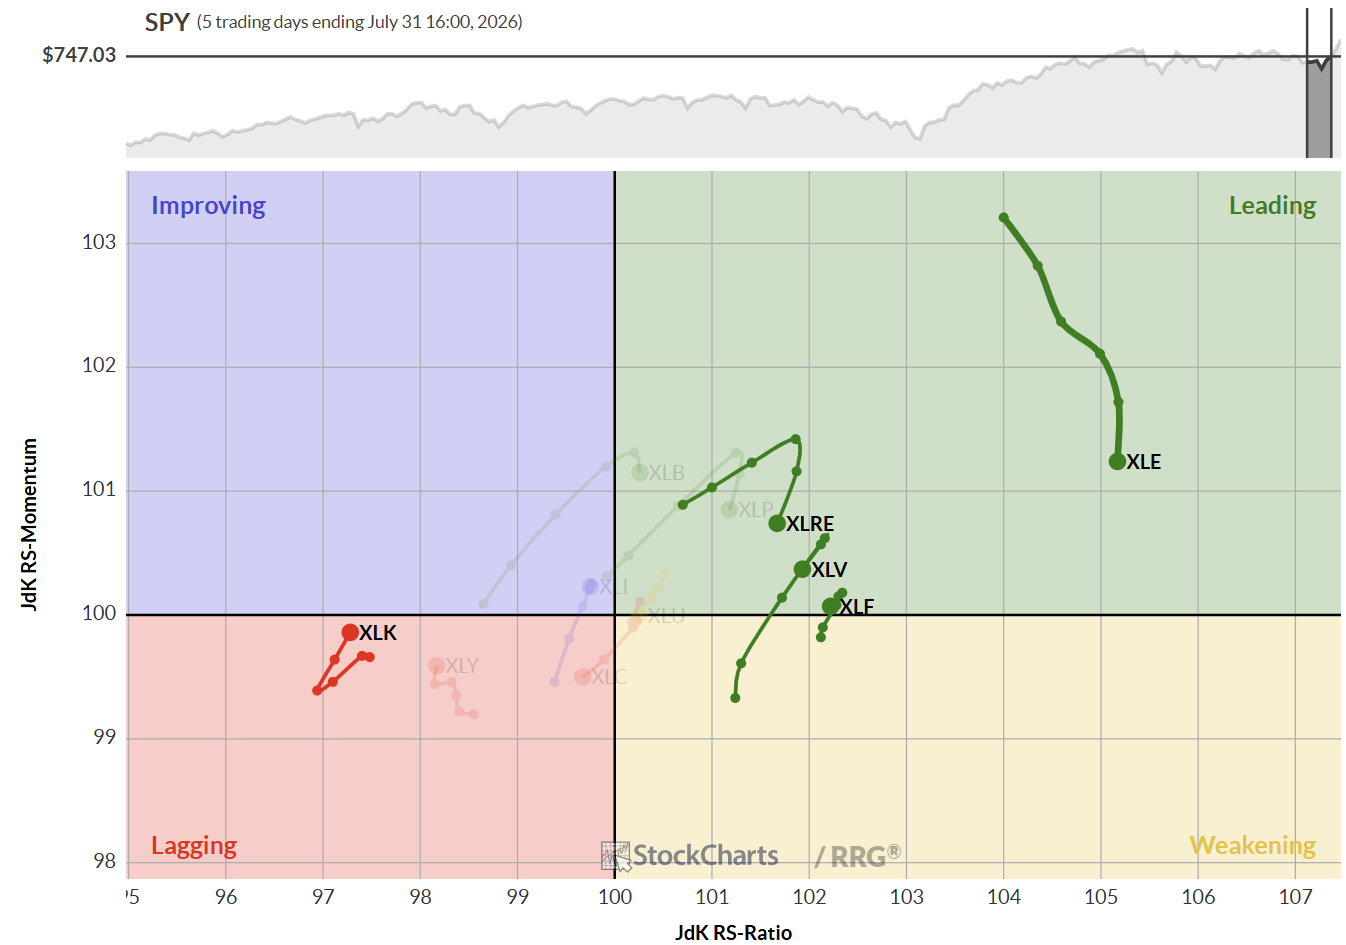
On the daily chart, Energy shines the brightest. It moved from lagging, through improving, and now sits in the leading corner, pushing it into the top‑five list. Real Estate, Health Care and Financials are also in the leading corner but are turning downward, which may need a closer look.
Sector Spotlights
Technology
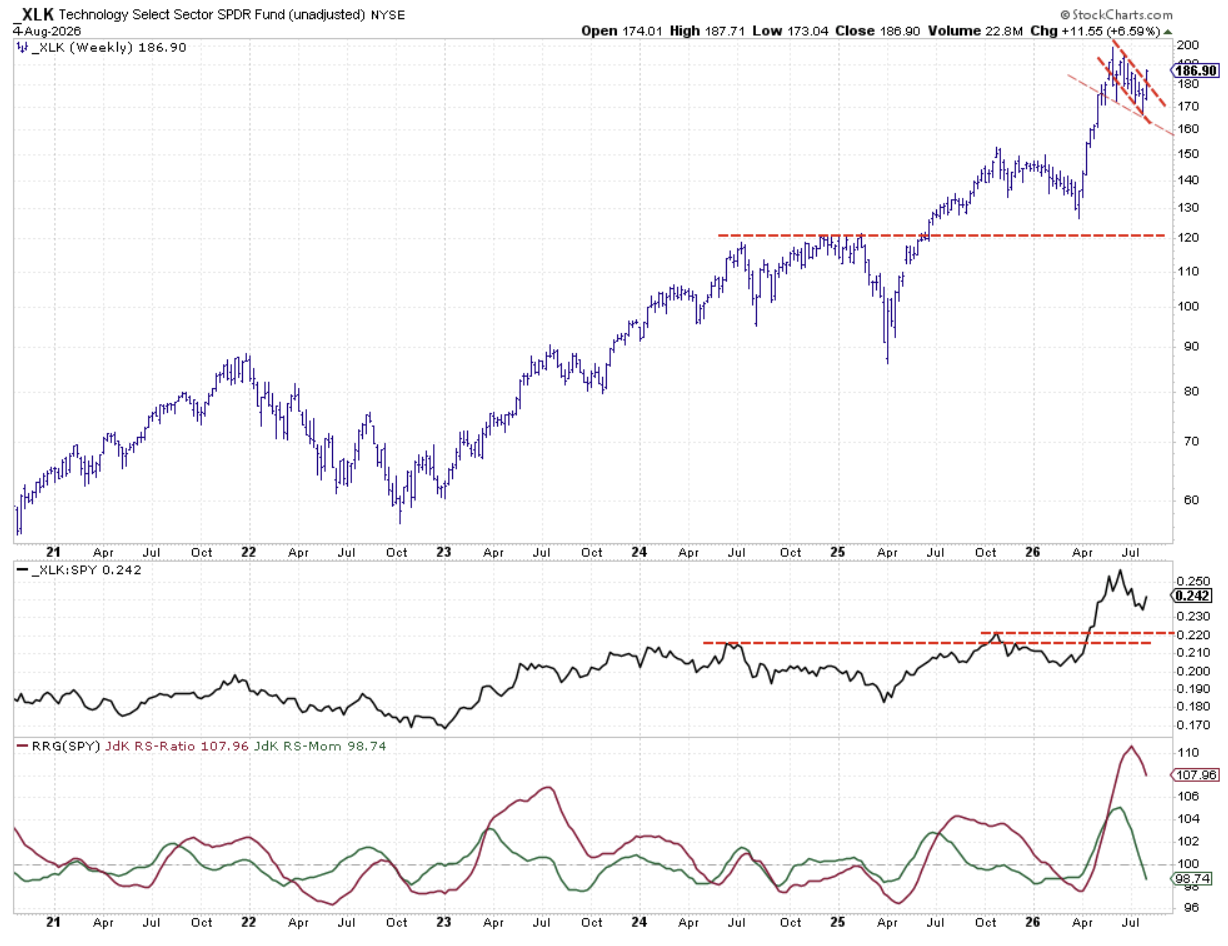
Technology stays the leader of the portfolio. The daily RRG shows a quick jump back into the lagging area, but the price broke out of a two‑month range, hinting at more upside. The raw relative‑strength line is forming a higher low, a good sign, even though the RRG lines are still adjusting.
Energy
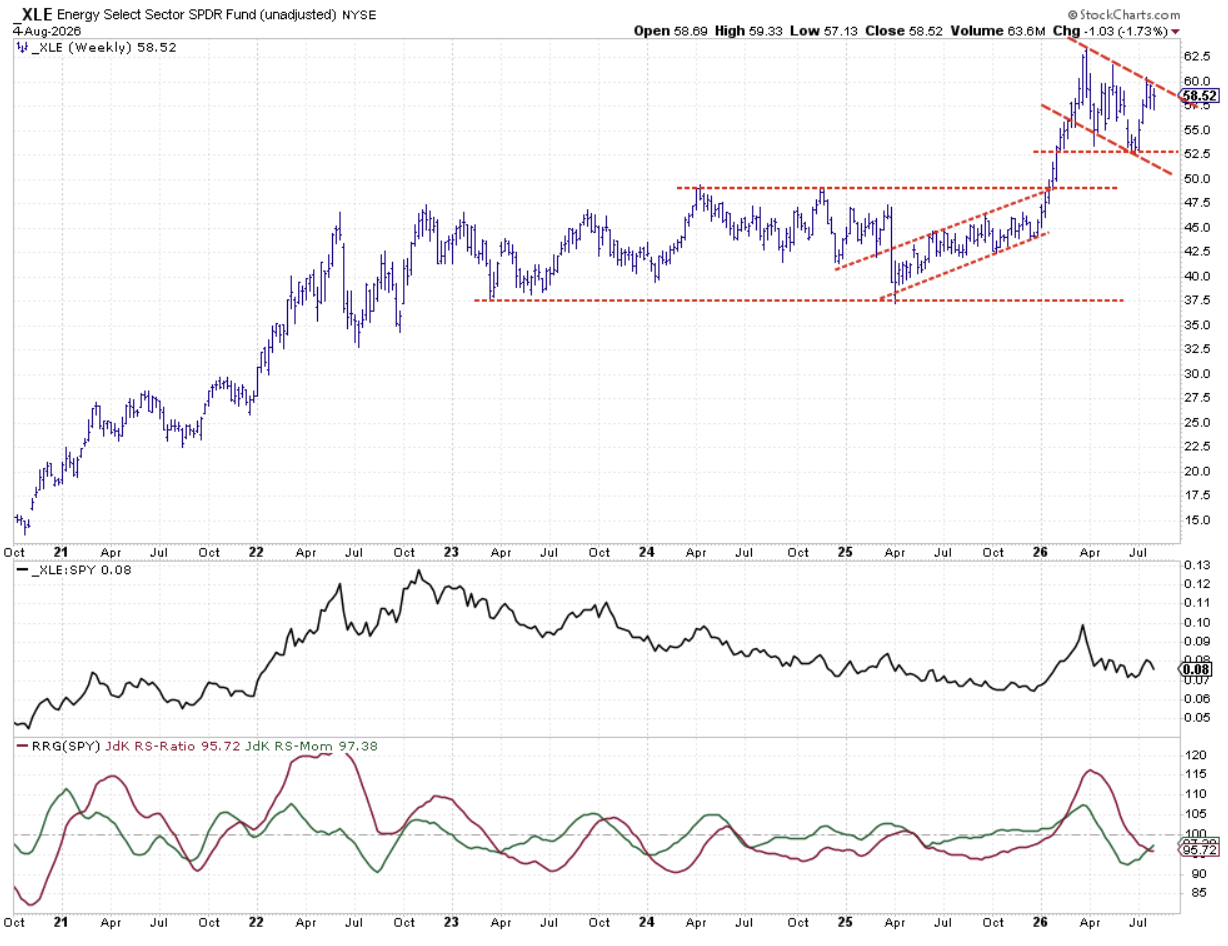
Energy is pushing against a falling trend line that has been tested three times, making it reliable. A parallel line below shows a short consolidation after breaking out of a long‑term range that lasted from 2023‑2025. If the price climbs above $60, it could spark more gains and lift the raw relative‑strength line.
Financials
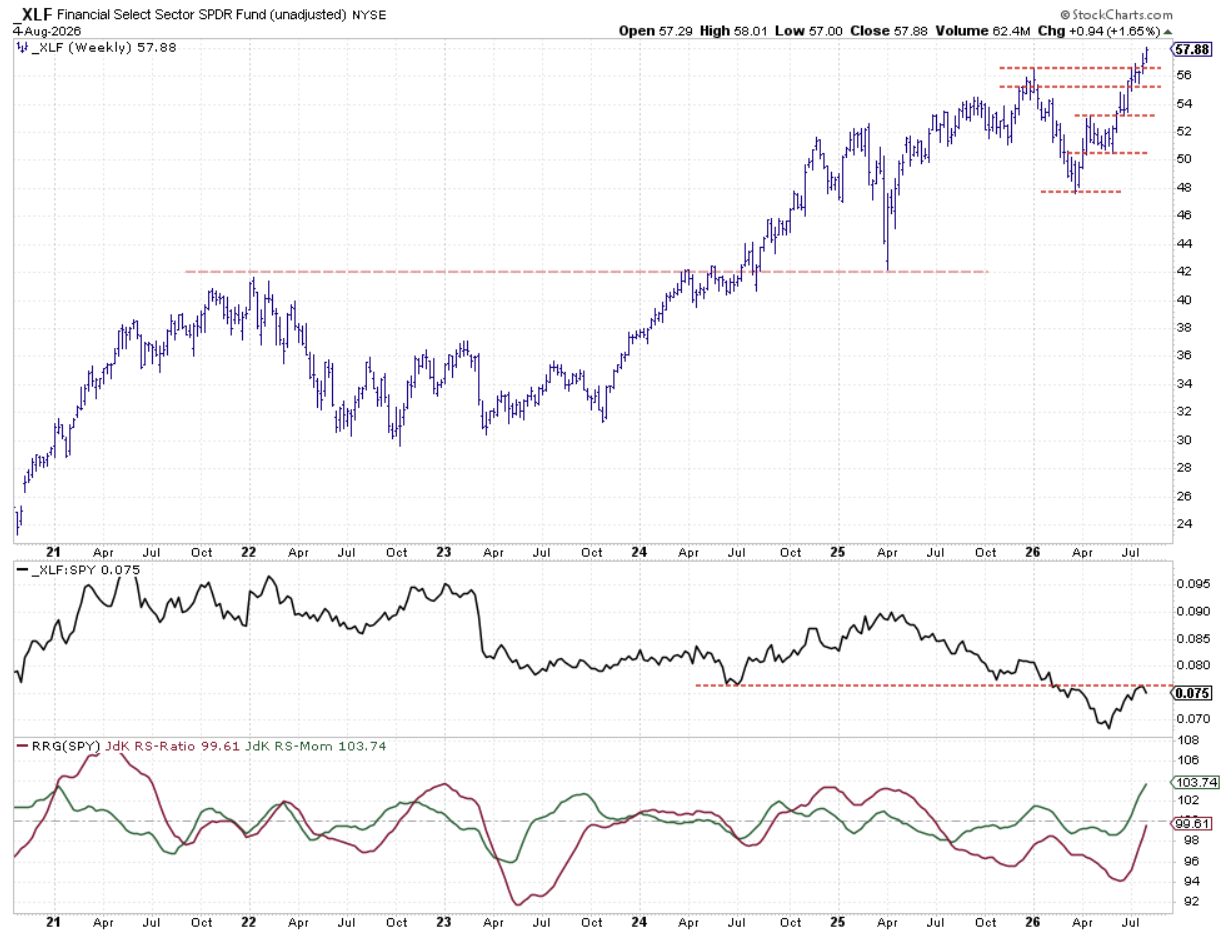
The Financials ETF broke through its previous high and is holding steady. The relative‑strength line is now acting as resistance, but the breakout should push the raw line higher. Both RRG lines point upward, with momentum well above 100, suggesting a move back into the leading corner.
Real Estate
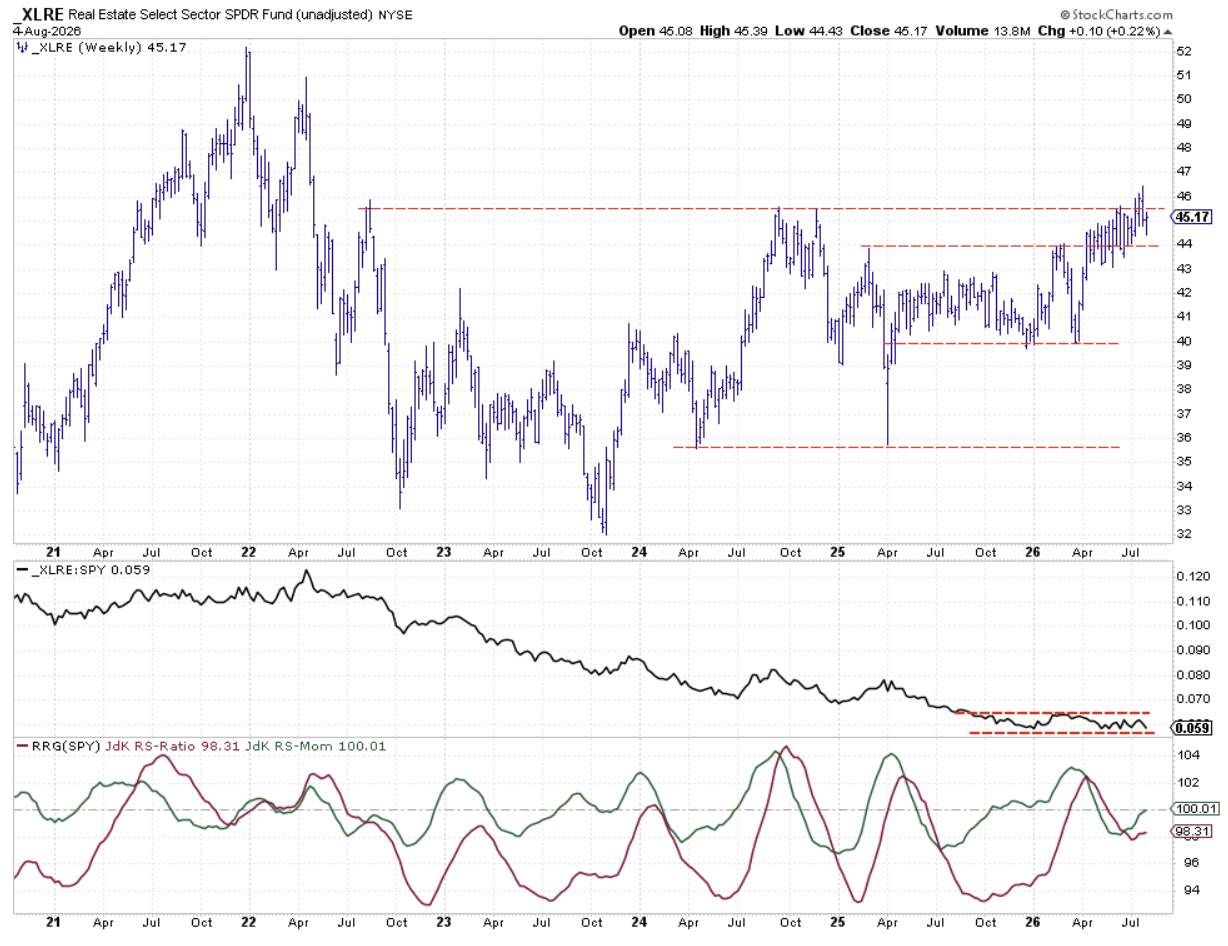
Real Estate is still fighting a ceiling near 46. The price has slipped back under 45.5, and the raw relative‑strength line is narrow. However, the RRG lines are turning a little more positive after a long downtrend.
Health Care
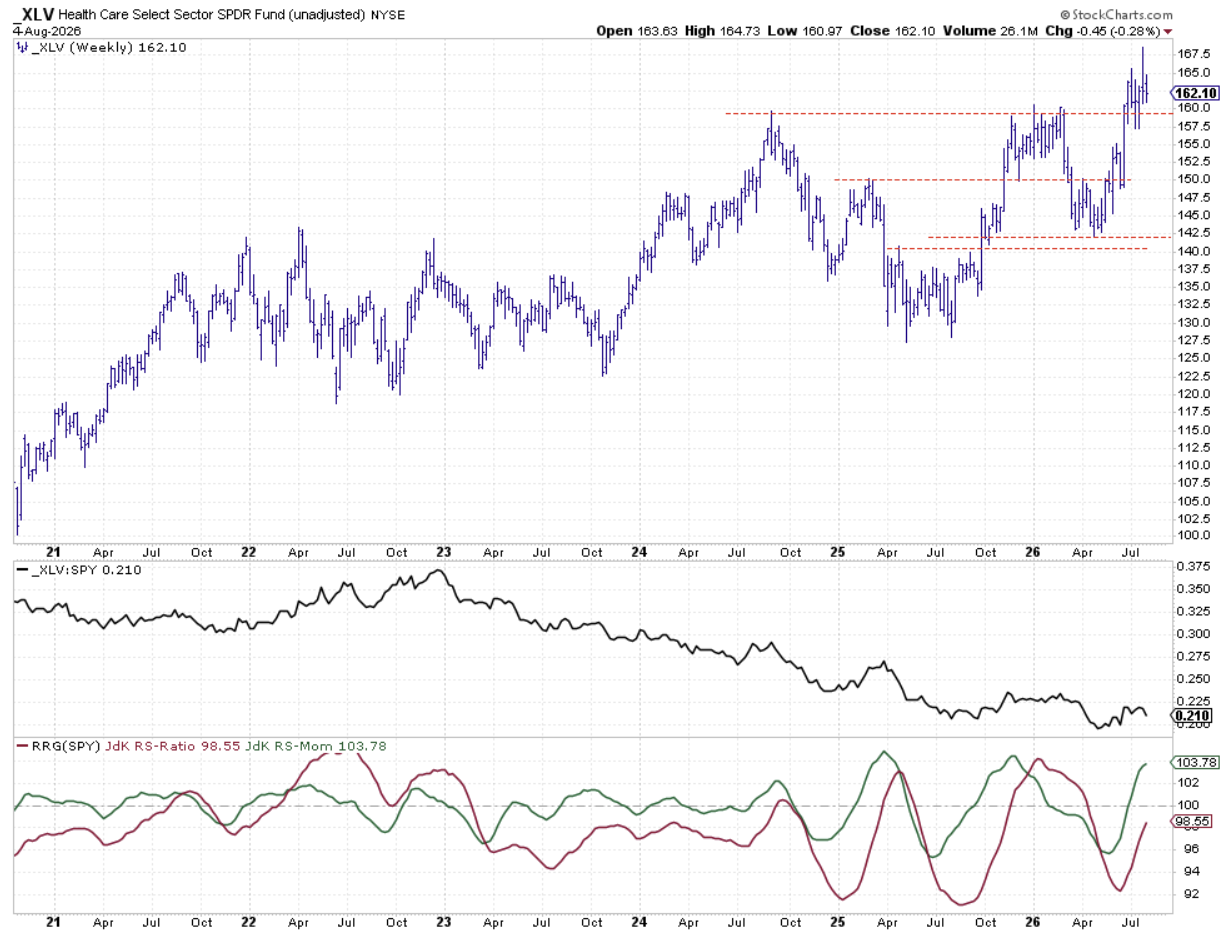
Health Care broke a small resistance level just below 160 and is holding firm. The downward tilt in relative strength is easing, though it hasn’t turned up yet. RRG lines show improvement, with momentum above 100 and the ratio line beginning to rise.
Portfolio Snapshot and Outlook
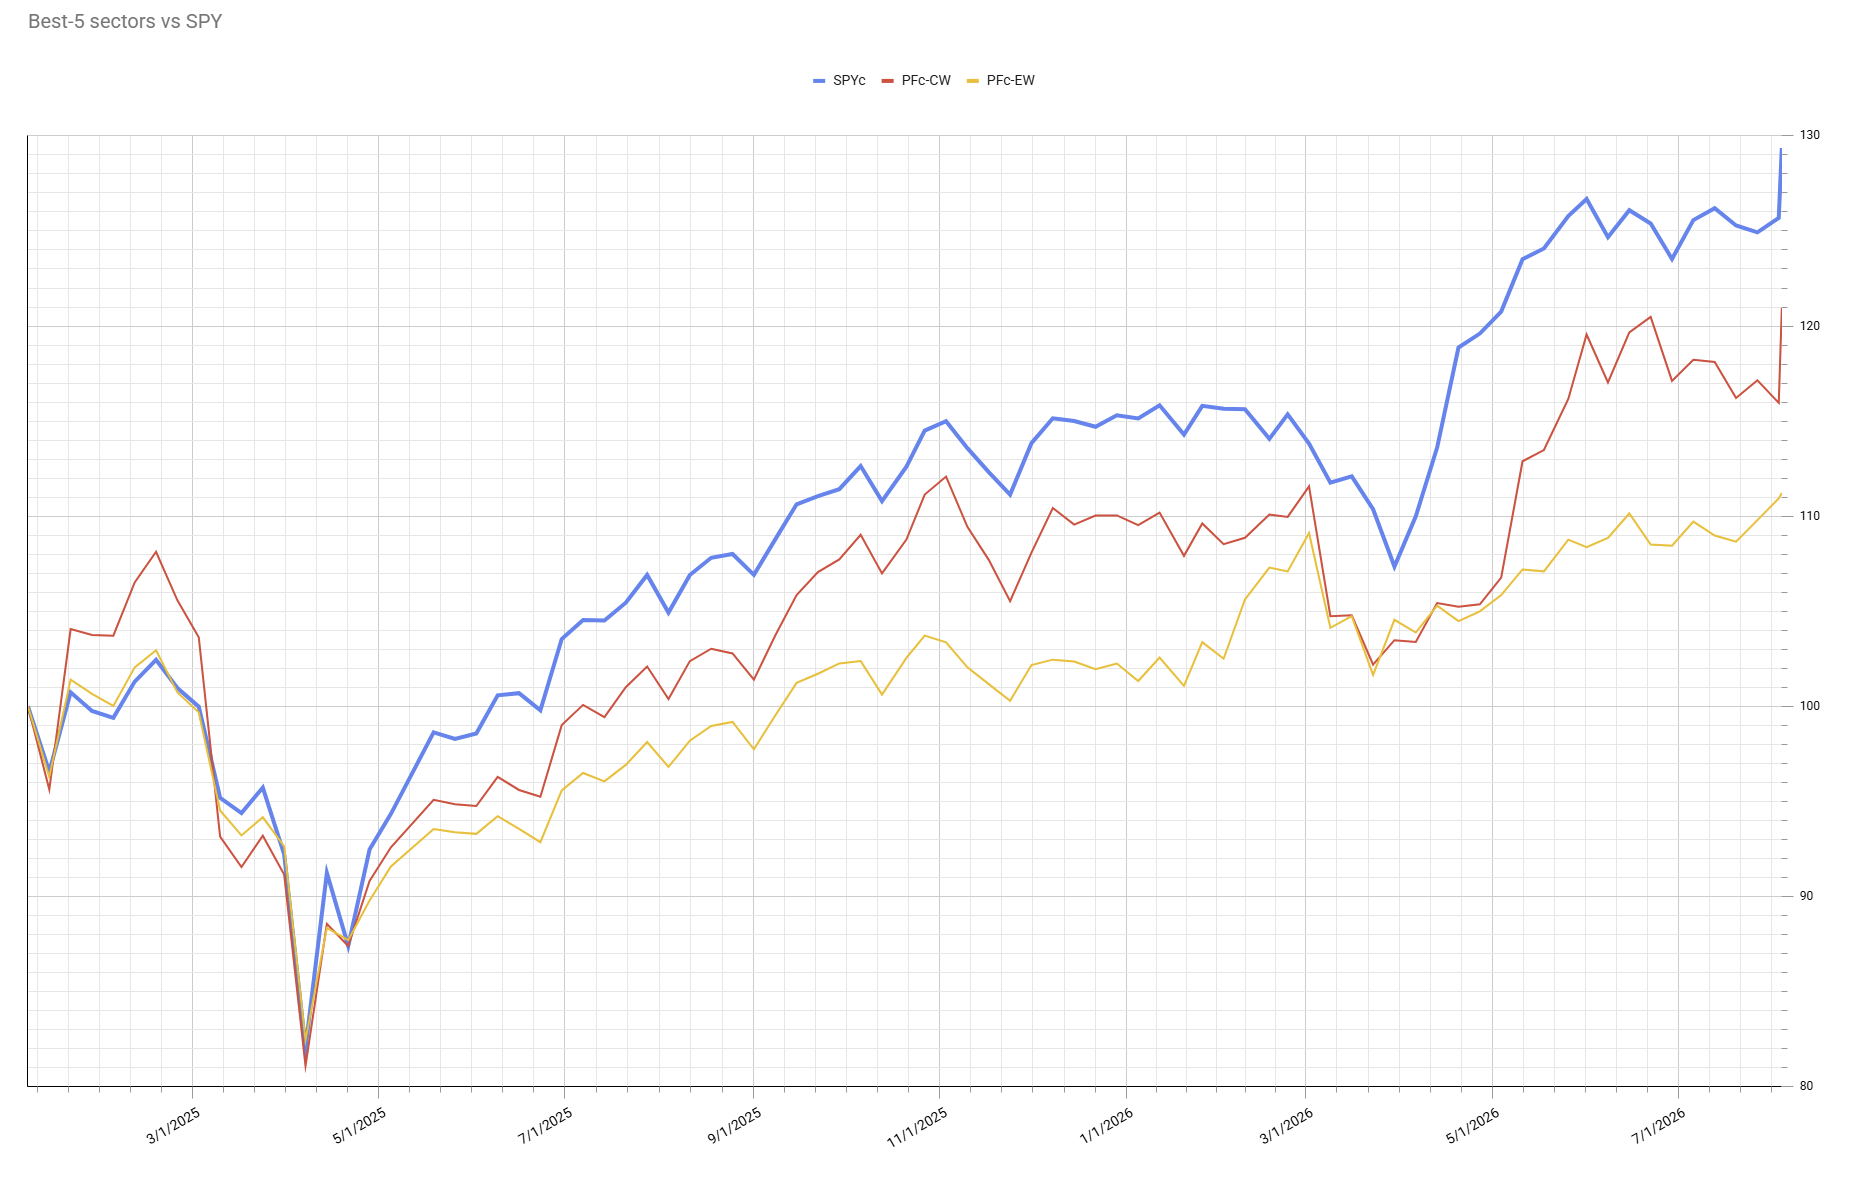
The portfolio lost about 1 % in the first week but regained it in the second, ending with almost no net change. It still trails the S&P 500 by a little over 8 %. Financials and Health Care are the strongest parts right now, while Energy could be an extra boost. From a sector‑rotation view, the mix looks ready to catch up to the broader market and perhaps move ahead in the future.
Source: Materials provided by https://articles.stockcharts.com.Note: Content may be edited for style and length.