


August began with a bold, risk‑on mood. Strong earnings from many tech firms pushed stocks higher, and the hope of a peace deal between the United States and Iran added optimism.
The rally was not limited to big‑cap tech. Small‑cap, mid‑cap and transportation stocks also rose. Most sectors of the S&P 500 finished in positive territory, and the few that fell did so only slightly. The Dow Jones and the S&P 500 closed at record highs. The Nasdaq broke above its short‑term downtrend and jumped about 2.6%.
Palantir Technologies was a big mover. After reporting strong earnings, its shares surged almost 30%.
SpaceX reported its first earnings as a public company, and the stock slipped in after‑hours trading. Advanced Micro Devices (AMD) also fell after its earnings release.
These drops are not likely to change the overall market tone unless news shows the U.S.–Iran peace talks are failing.
Technology Takes the Lead
The technology sector was the strongest performer on Tuesday. The Technology Select Sector SPDR ETF (XLK) jumped higher, breaking above its downward‑sloping trend line and its 50‑day simple moving average.
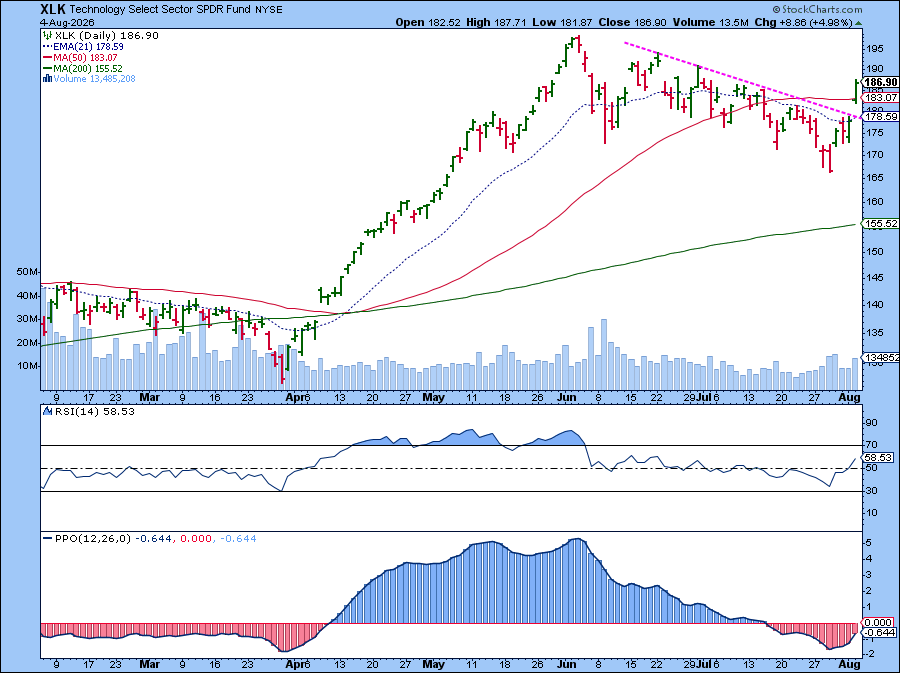
Both the Relative Strength Index (RSI) and the Percentage Price Oscillator (PPO) moved into bullish zones. If the RSI climbs above 70 and the PPO stays positive, technology stocks could keep climbing.
Nasdaq Breakout
The Nasdaq showed a similar pattern. The index rose 2.6%, moving past the 26,250 level and testing the 26,700 area before closing slightly lower.
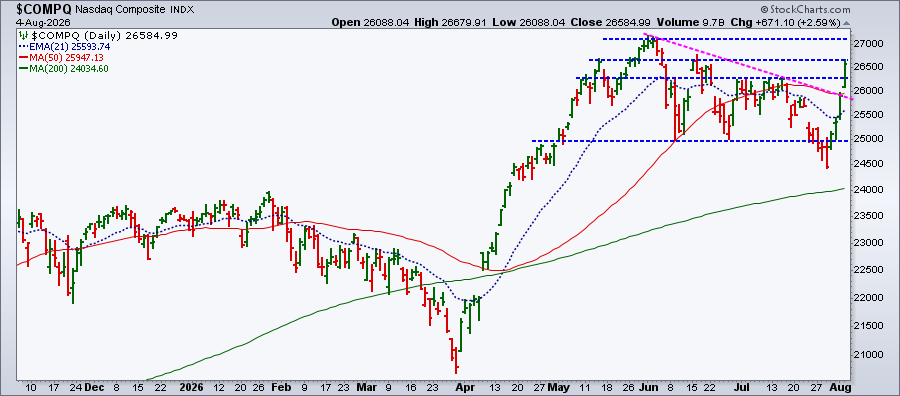
The break of the downward trend line adds support to the bullish case. If the index pulls back to the identified support zones, it could create a buying opportunity for patient investors.
Falling Oil Prices Provide Relief
Crude oil prices fell, with both West Texas Intermediate and Brent trading below $80 a barrel and under their 200‑day simple moving averages.
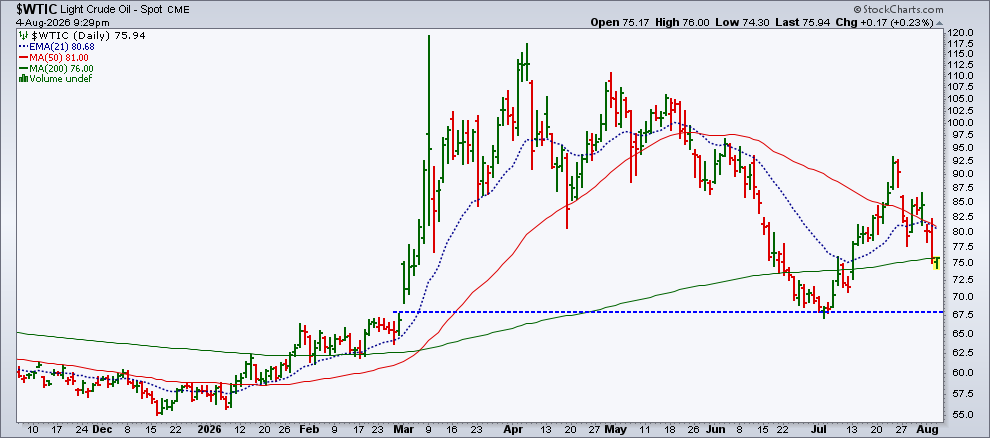
If Middle‑East tensions stay low, WTI could slide toward $67.50. A flare‑up, however, could push oil back above its 200‑day SMA and the 21‑day exponential moving average.
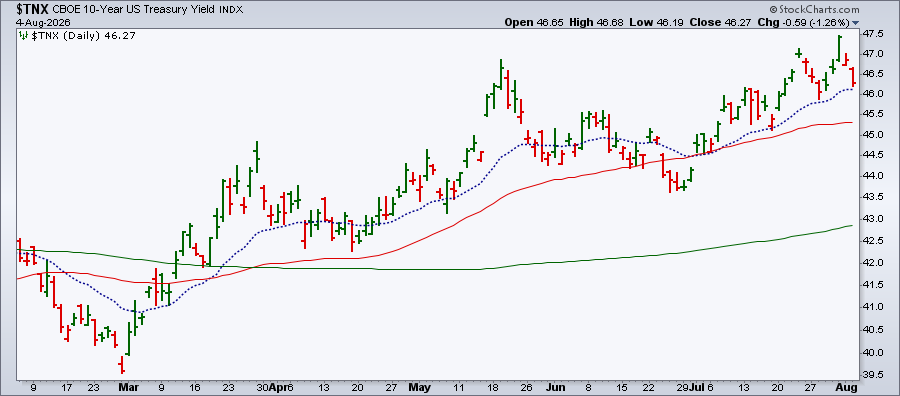
Lower oil prices ease inflation worries and make another rate hike less likely this year. The 10‑year U.S. Treasury yield fell after hitting a high of 4.74% on July 31, 2025, but it still sits above its short‑term trend. The 21‑day EMA now acts as the first level of support.
Watch Volatility Closely
The CBOE Volatility Index (VIX) rose about 4% on Tuesday, even as stocks hit new highs.
When markets feel very optimistic, I like to glance at other assets—oil, bonds, and volatility—to see if any warning signs appear. At the moment, nothing looks likely to burst the bull run, but conditions can change quickly. Keep an eye on the market dashboard and summary pages to stay aware of shifts in leadership, momentum, and risk.
Disclaimer: This article is for educational purposes only and does not constitute financial advice. Always consider your personal financial situation and consult a professional before making investment decisions.
Source: Materials provided by https://articles.stockcharts.com.Note: Content may be edited for style and length.