

The S&P 500 is starting a retail earnings week on a hot note. After a tiny pull‑back on Friday, large‑cap U.S. stocks set a new record‑high weekly close. The data this week matched what the market’s more cautious side wanted: cooler CPI, calm PPI, and a modest retail‑sales report.
We will hear from several big retailers about how consumers are spending. Home Depot opens the day on Tuesday, followed by Lowe’s, TJX Companies and Target on Wednesday. All of the dates are listed on the earnings calendar.
All Eyes on Walmart
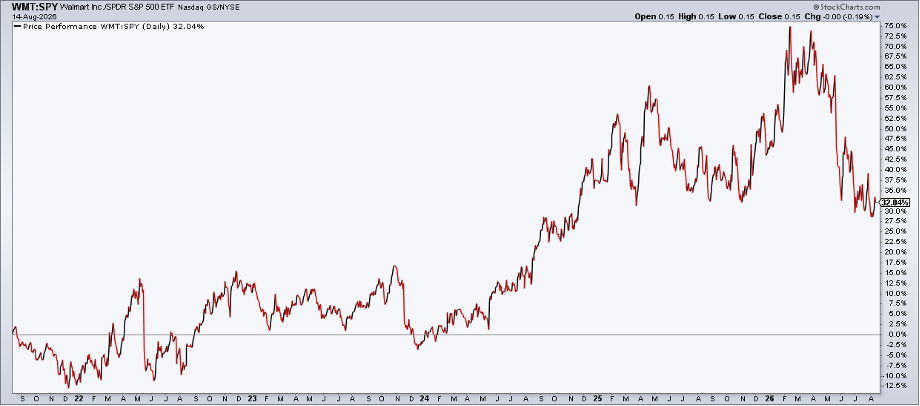
Walmart is the star of Thursday’s pre‑market session. The $917 billion consumer‑staples giant has lagged since February even though shoppers are still spending. The chart tells a mixed story.
Walmart’s price has been stuck below a key resistance level near $118. The 200‑day moving average has flattened, showing a tug‑of‑war between bulls and bears. Below $118 the bias stays bearish. Support around $105‑$107 is also important. The stock is trading near $115, so a big drop is unlikely, but volatility is high—about 29%, twice the S&P 500’s level.
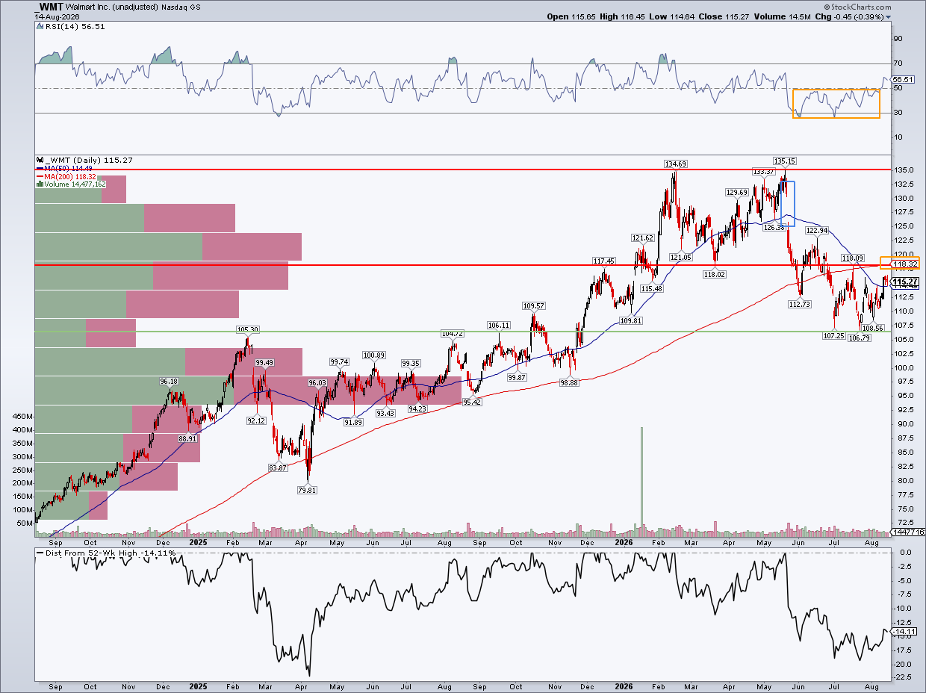
The RSI momentum indicator has turned upward, breaking back to levels seen before the May earnings dip. That gives bulls some hope of narrowing the 14% gap from the 52‑week high.
Seasonal Outlook
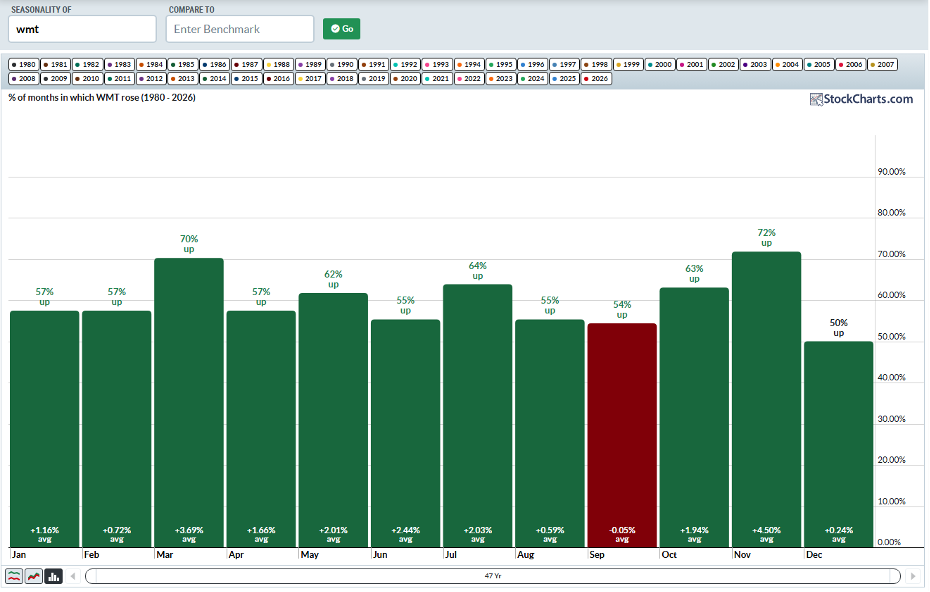
Our new seasonality tool shows that August‑to‑September has been fairly flat for Walmart over the decades. Since 1980, average returns are +0.59% in August and –0.05% in September. Bigger moves tend to happen in the fourth quarter.
What About the Retail ETF?
The SPDR S&P Retail ETF (XRT) has slipped from its multi‑year high. The fund is now testing its 50‑day moving average after a bullish “golden cross” a month ago. Volume shows a heavy cluster between $75 and $90, suggesting the price could wobble before any breakout.
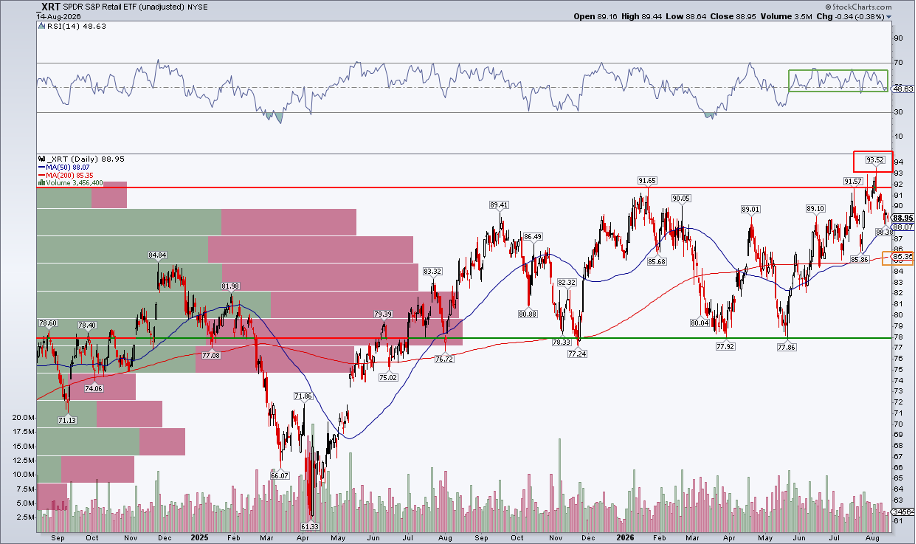
If XRT can push past $92 and make a new multi‑year high, it would support a broader market rally.
Macro Factors: Gas Prices
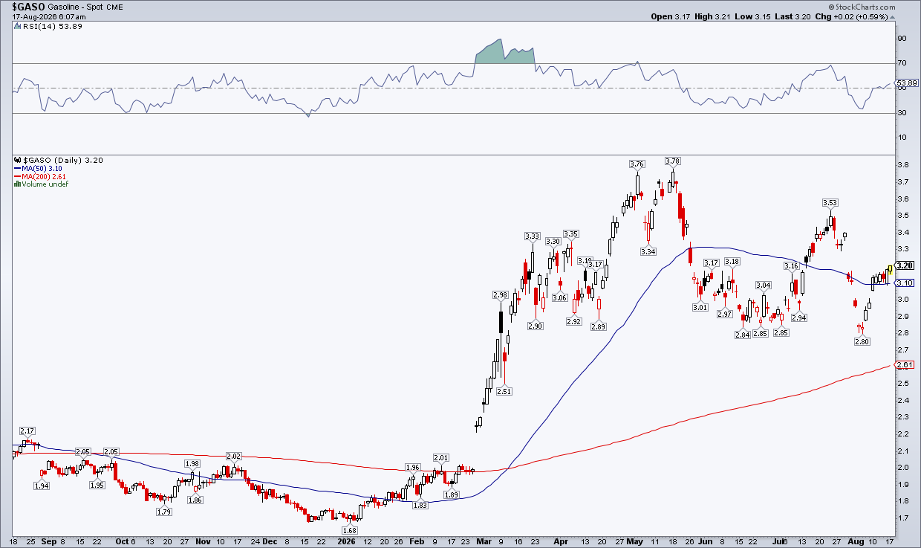
Gasoline futures have hovered near $3.20 per gallon, adding pressure on shoppers. The October RBOB contract, which reflects a cheaper winter blend, is trading around $2.90. This could give drivers a modest relief later this month.
Bottom Line
This week’s retailer earnings will show whether consumers keep spending. Home‑improvement stores, discounters and big‑box retailers will all release Q2 numbers. Walmart’s chart points to weakness, while the XRT ETF has slipped from its summer high. Traders should watch both technical signals and the macro backdrop to gauge where consumer‑driven stocks might head for the rest of the year.
Disclaimer: This article is for educational purposes only and does not constitute financial advice.
Source: Materials provided by https://articles.stockcharts.com.Note: Content may be edited for style and length.