

The market moved mostly sideways this week and closed a bit lower. The Nifty bounced between 24,266 and 24,621 points. Higher prices faced selling pressure, so the rally could not continue.
Volatility fell as the India VIX dropped about 7% to 11.31, showing that traders were not very nervous. At week’s end the Nifty settled at 24,366, down 205 points (‑0.83%).
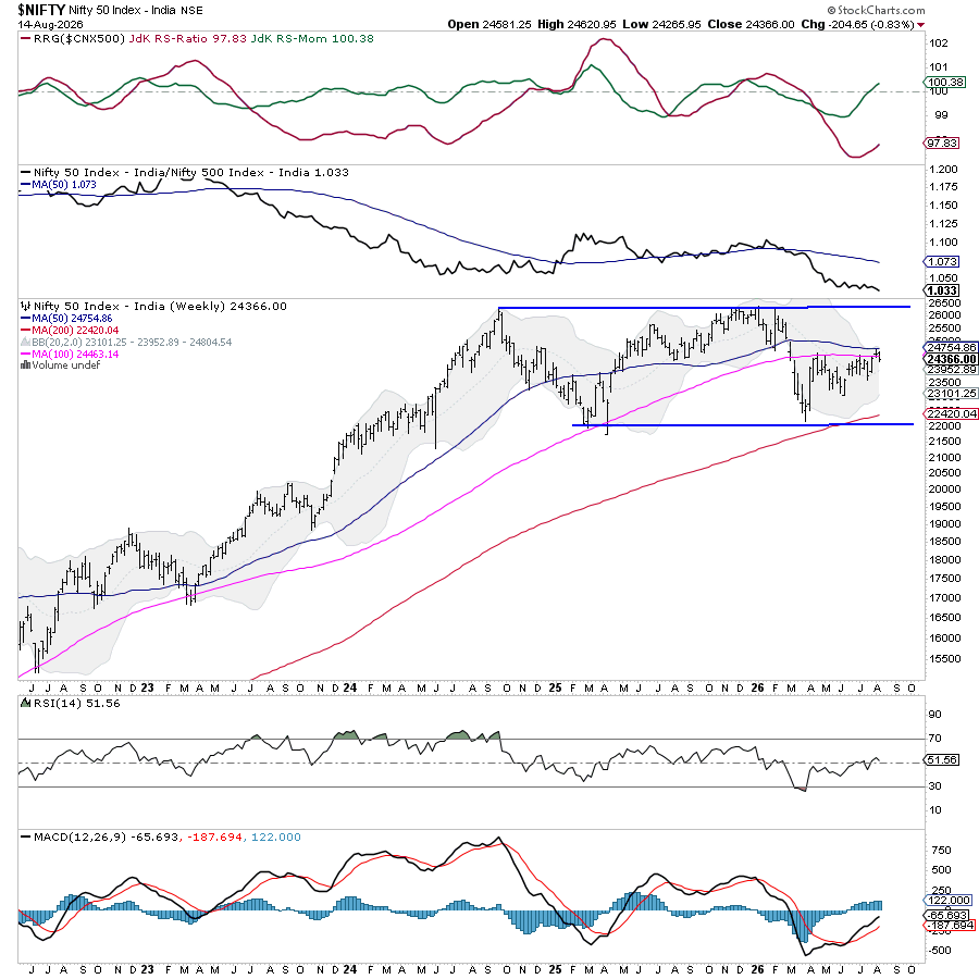
Technical patterns still show the index in a consolidation phase. A big hurdle sits between 24,500 and 24,750 points, where the 200‑day, 50‑week and 100‑week moving averages overlap.
This cluster makes it hard for the price to move up. A clear break above 24,750 would improve the outlook and could start a stronger uptrend. Until then, the index will likely stay in a tight range with a modest downside tilt.
On the downside, the 23,950‑24,000 zone acts as near‑term support. A break below this area could open the door to further weakness.
Looking ahead, the Nifty will probably stay quiet unless it can push through the moving‑average cluster. Key resistance levels are at 24,500 and 24,750; key supports are at 24,000 and 23,800. How the price behaves around 24,500‑24,750 will be crucial.
The weekly RSI is 51.6, staying neutral and just above the 50 mark. It does not yet show strong momentum. The MACD remains bullish and sits above its signal line.
Pattern analysis confirms a multi‑month consolidation. The 50‑week moving average at 24,754.9 is a strong ceiling, while the 100‑week average at 24,464.1 is being tested. The 20‑week average (about 23,953) offers additional support. A decisive move above the 24,500‑24,750 band is needed for a clearer trend.
For the coming week, a cautious, stock‑specific approach is advised. Low volatility means there is no clear directional trigger. Consider buying stocks that show relative strength and clear breakouts, while protecting profits near the 24,500‑24,750 resistance. A firm break above 24,750 could justify more long positions; a fall through 23,950‑24,000 calls for extra caution. Until one of these boundaries is resolved, stay selective, avoid chasing big moves, and keep overall exposure modest.
Sector Outlook for the Week
We used Relative Rotation Graphs (RRG) to compare sector performance against the CNX500, which represents most of the market’s free‑float value.
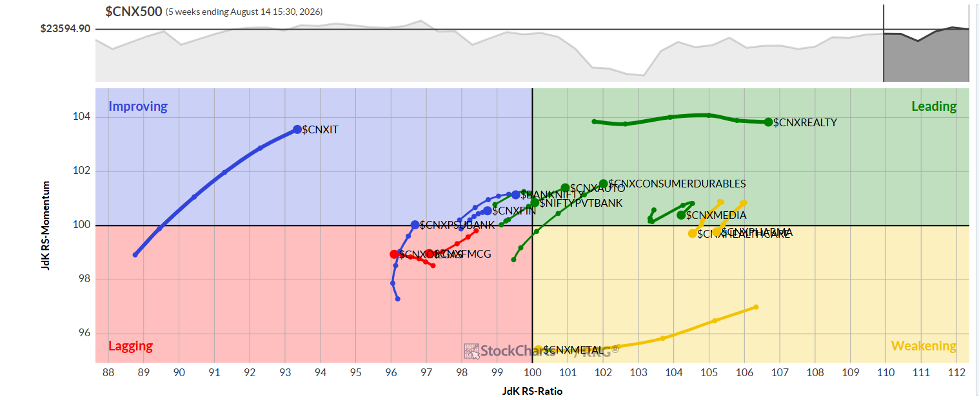
The Auto sector moved into the leading quadrant, joining Realty and Media. These three may beat the market in the short term.
Pharma slipped into the weakening quadrant, as did Mid‑Cap 100, Energy and Metals. They could see slower growth.
Infrastructure, PSE and FMCG remain in the lagging quadrant. The PSU Bank index, though still in the leading quadrant, is gaining momentum relative to the broader market.
IT, Financial Services, Services and the Bank index sit in the improving quadrant.
Note: RRG charts show relative strength and momentum versus the CNX500. They are not direct buy or sell signals.
Source: Materials provided by https://articles.stockcharts.com.Note: Content may be edited for style and length.