
The S&P 500 reached a new record high, climbing 3.6% for its best week since April. The rally was global – the Vanguard FTSE All‑World ex‑US ETF also posted a record weekly gain.
Even though the big‑picture economy feels shaky, price moves are looking brighter. Some investors worry about the conflict in Iran, which could push oil prices and Treasury yields higher.
Gold Posts Biggest Weekly Gain Since January
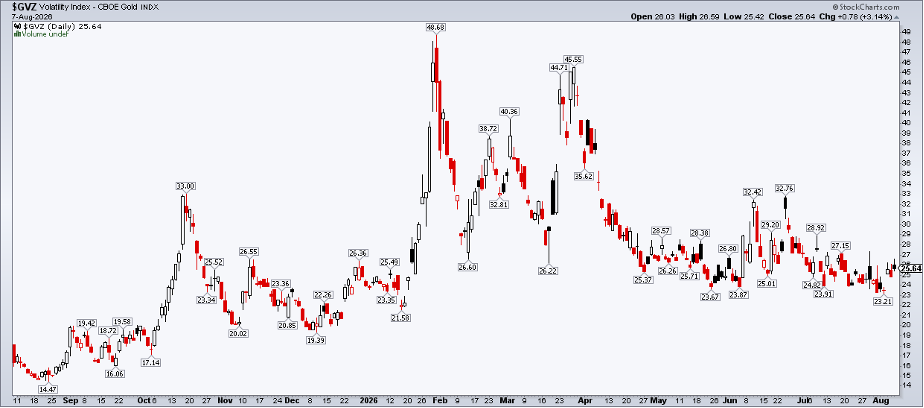
Gold jumped 7.5% this week, the strongest rise since the record‑setting run in January. The move came out of nowhere – the gold‑volatility index had been flat for months.
On a yearly basis, gold is back in the black, up about 0.5% ahead of the July CPI, PPI and retail‑sales reports.
Downtrend Line Cracked
Spot gold moved above its short‑term 50‑day moving average on Wednesday. A bright, long‑body candle marked the best session since early February and smashed a long‑standing resistance line from early Q1.
The RSI momentum indicator is now at its highest level since late January, confirming the price rise. However, the 200‑day moving average is flat, and the $4,500‑$4,600 zone could act as resistance.
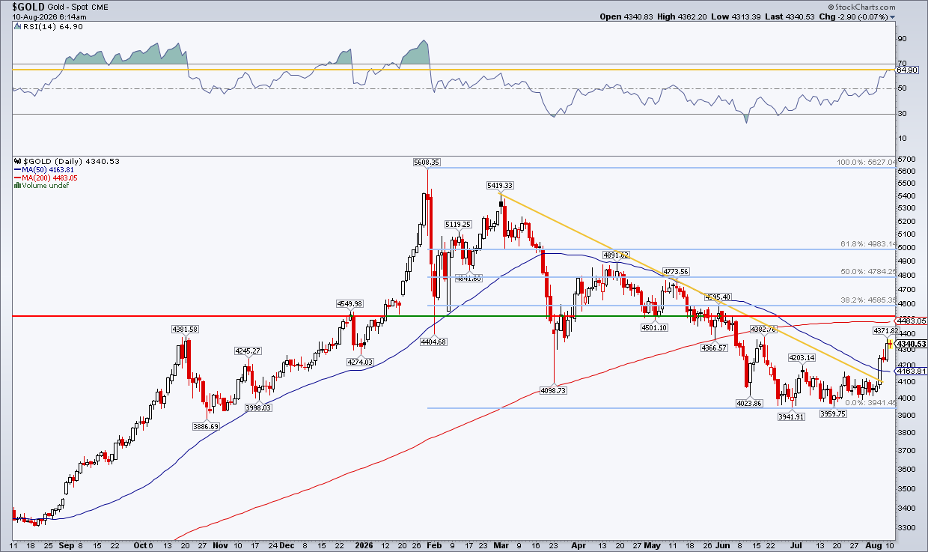
The rally looks strong, but gold may pause before the quarter ends. A short consolidation followed by a year‑end bounce is possible after the big price reset earlier this year.
Gold Miners Explode With Historic Gain
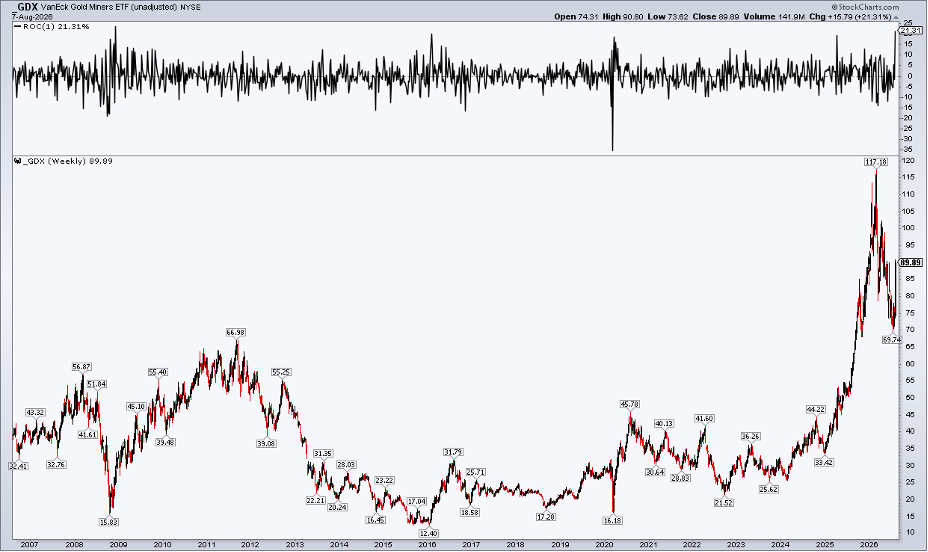
Gold‑mining stocks outperformed the metal itself. The VanEck Gold Miners ETF (GDX) surged 21.3% – the biggest weekly jump since December 2008.
GDX broke above its 50‑day moving average with strong volume. Its RSI is also at the best level since early this year, and the downtrend line has been broken, suggesting more upside.
Volume‑by‑price data shows solid support below last Friday’s close. A soft resistance area may appear around $92‑$93.
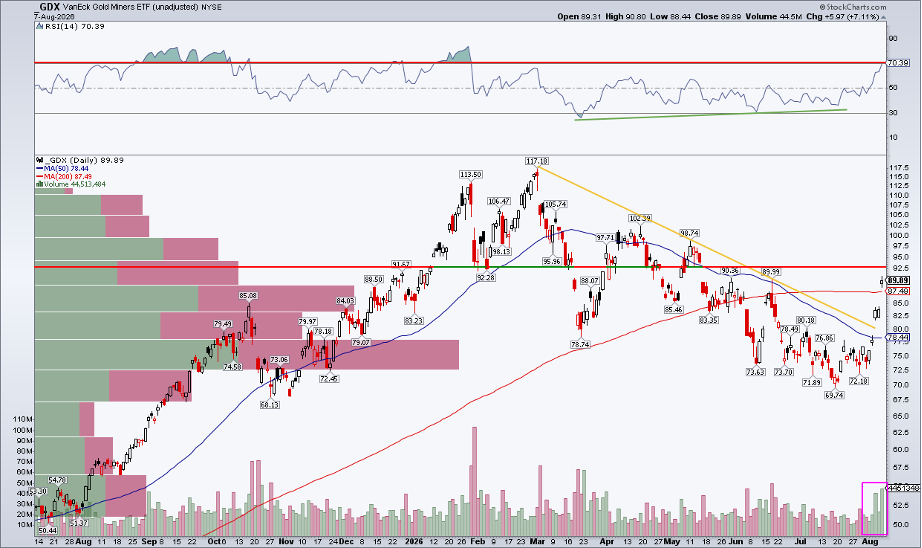
Looking back, GDX defended its September 2011 high of $67 earlier this summer. When a former resistance level turns into support, it often helps the price stay above that line.
What the Wider Market Shows
Higher real interest rates can be a drag on gold and miners, while rising oil prices may hurt miners in the short term. Even with these pressures, gold still shows strong absolute and relative performance, and Bitcoin is also gaining ground.
Some traders wonder if the "debasement trade" that was talked about for 2025 is back. Only time will tell if last week’s surge was a lasting move.
Bottom Line
Gold broke a major downtrend line at the start of August, moving up without a big news catalyst. The rise was about three times stronger in gold‑mining stocks. While rising real yields may limit further gains, the market is shifting from a "sell the rip" to a "buy the dip" attitude.
Disclaimer: This content is for educational purposes only and does not constitute financial advice.
Source: Materials provided by https://articles.stockcharts.com.Note: Content may be edited for style and length.