

Commodities have risen a lot since 2020. Investors now wonder if the rise can keep going.
Chart 1 shows four commodity indexes squeezed between two trendlines. The red line below has been tested many times, so it is strong support. If prices fall below it, the up‑trend could be in trouble. If prices break above the green line, it may mean the market is ready to move higher again.
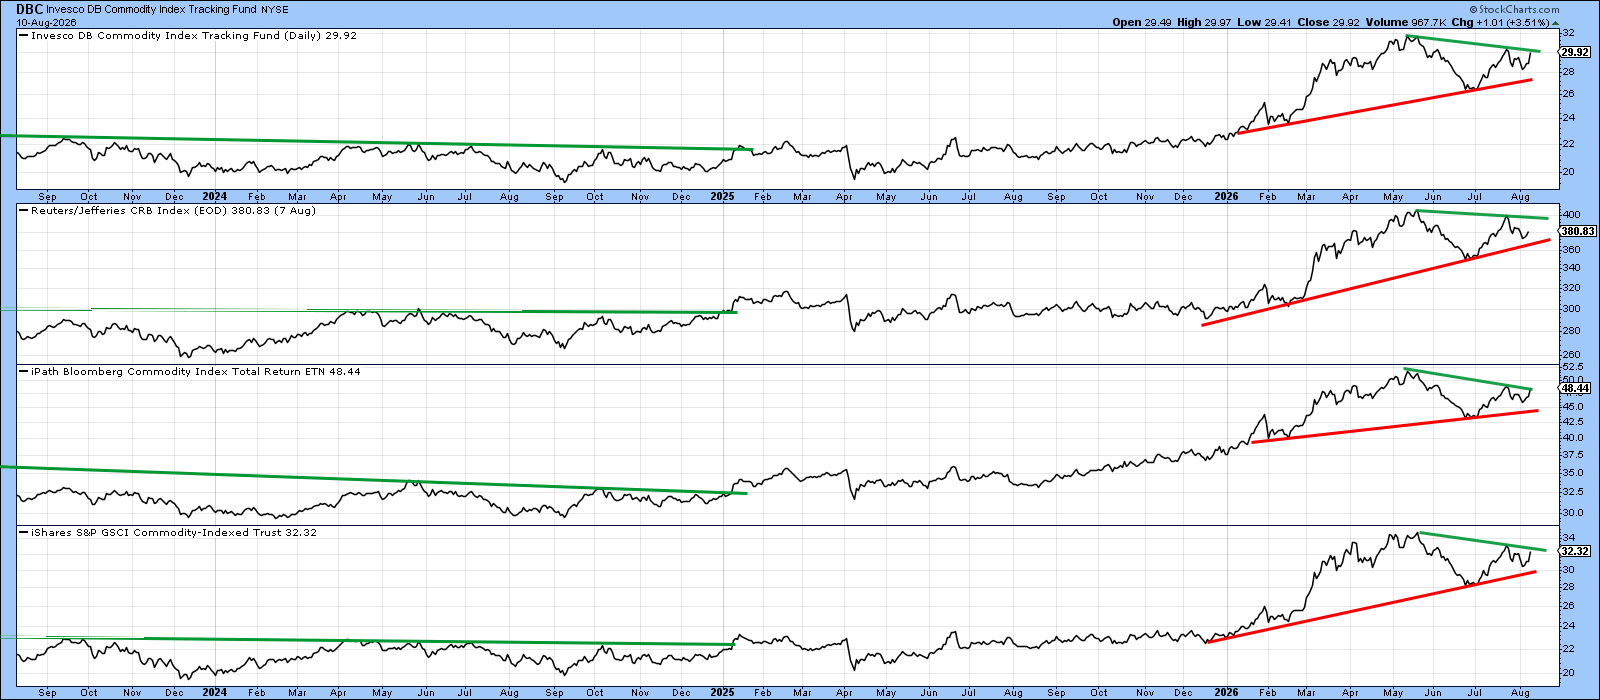
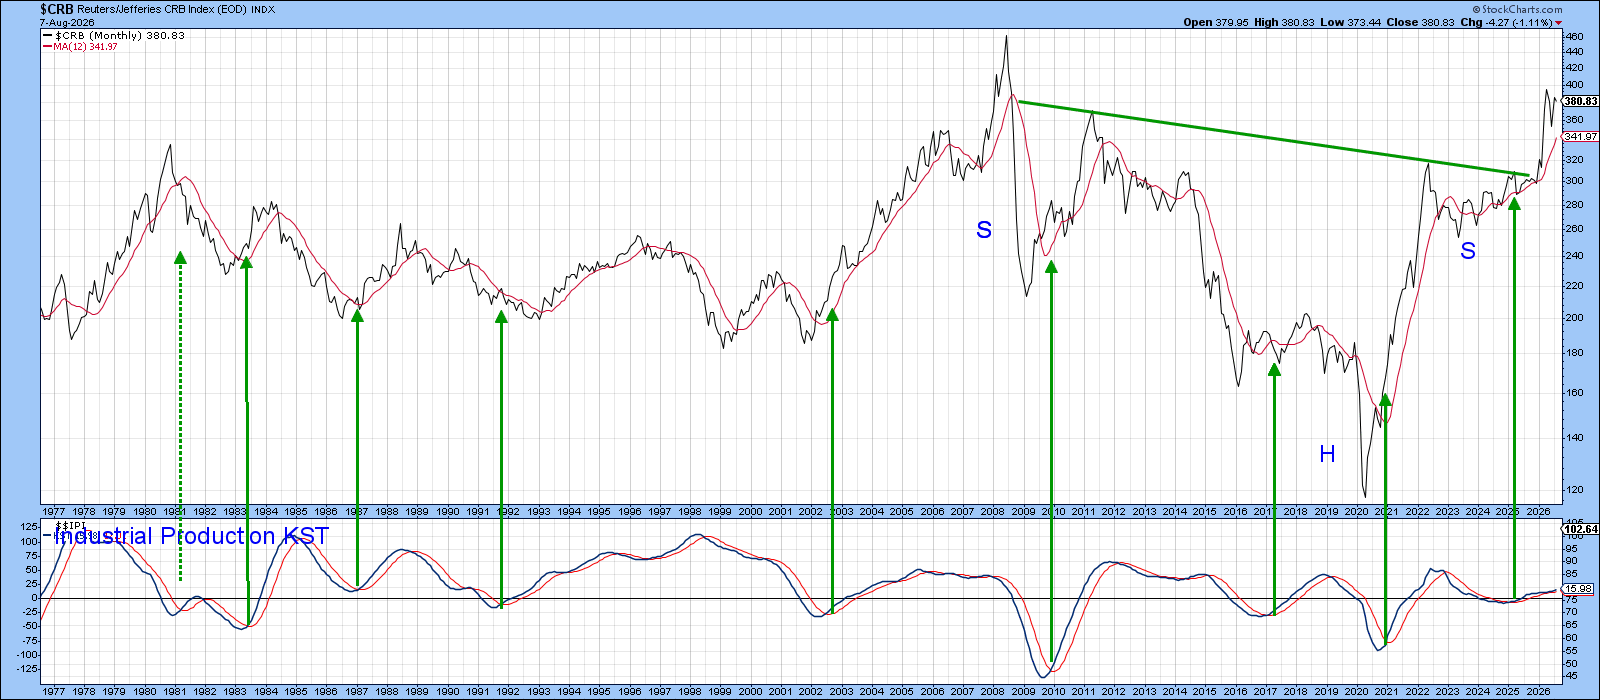
Chart 2 points to an upside move for two reasons. First, the long‑term Know Sure Thing (KST) for industrial production is still rising. When the economy gains speed, commodity prices usually follow.
Second, the CRB Composite ($CRB) just finished a long‑term inverse head‑and‑shoulders pattern. This pattern often signals a big next move, so the rally we see may be just the first step.
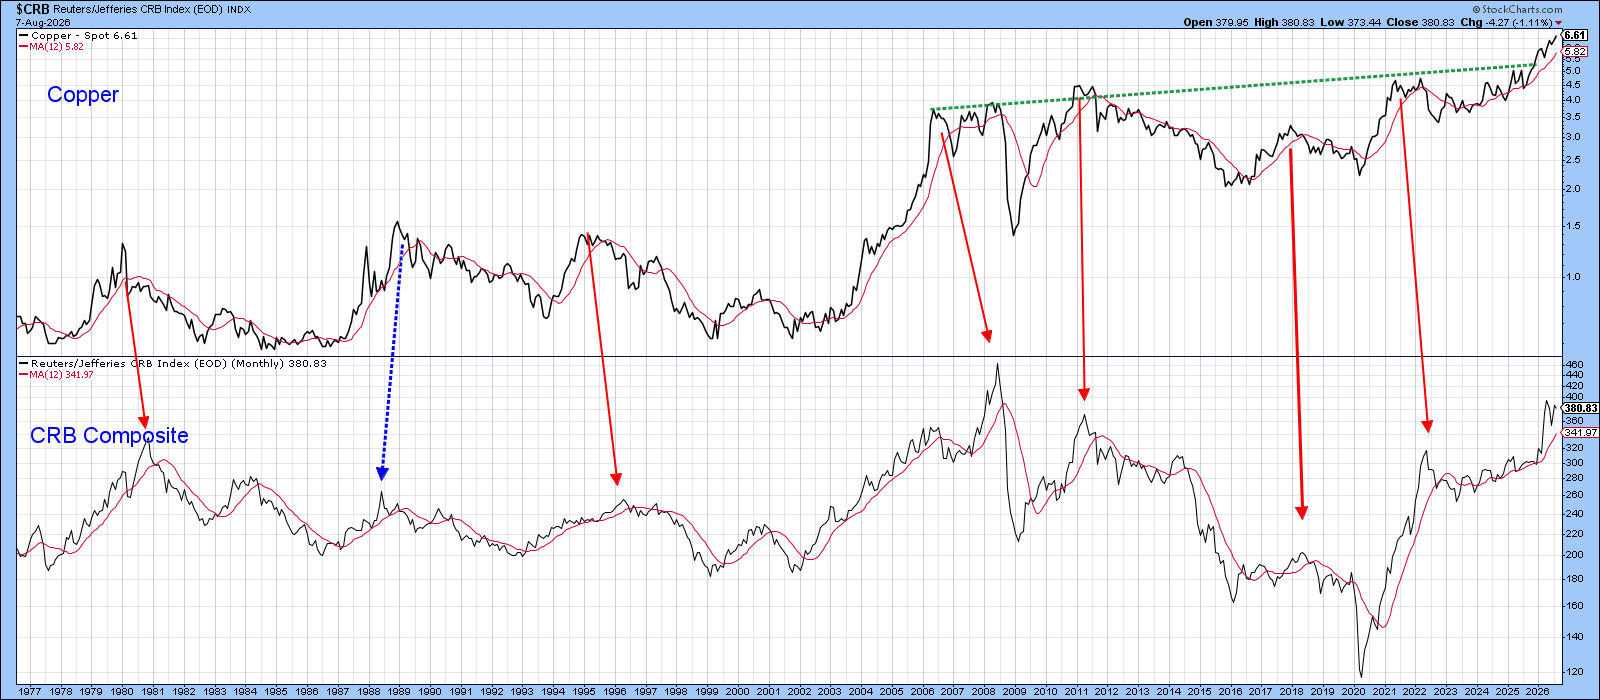
Copper also gives a bullish clue. Historically, copper peaks before the broader commodity market. Chart 3 shows that copper’s recent breakout often leads the CRB higher.
What Does the Stock Market Say?
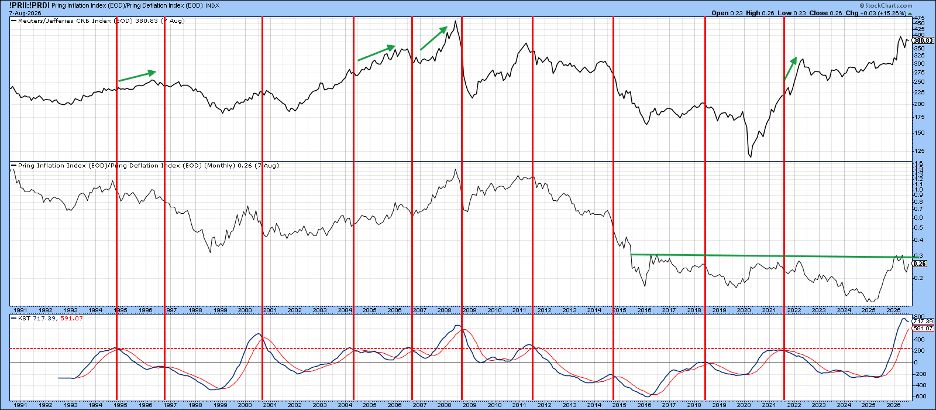
Chart 4 looks at a ratio of stocks that do well when commodities rise versus those that win in deflation. When the KST of this ratio hits a high, it sometimes matches a peak in the CRB, but not always. The current signal is a warning, not a final verdict.
Currency Clues
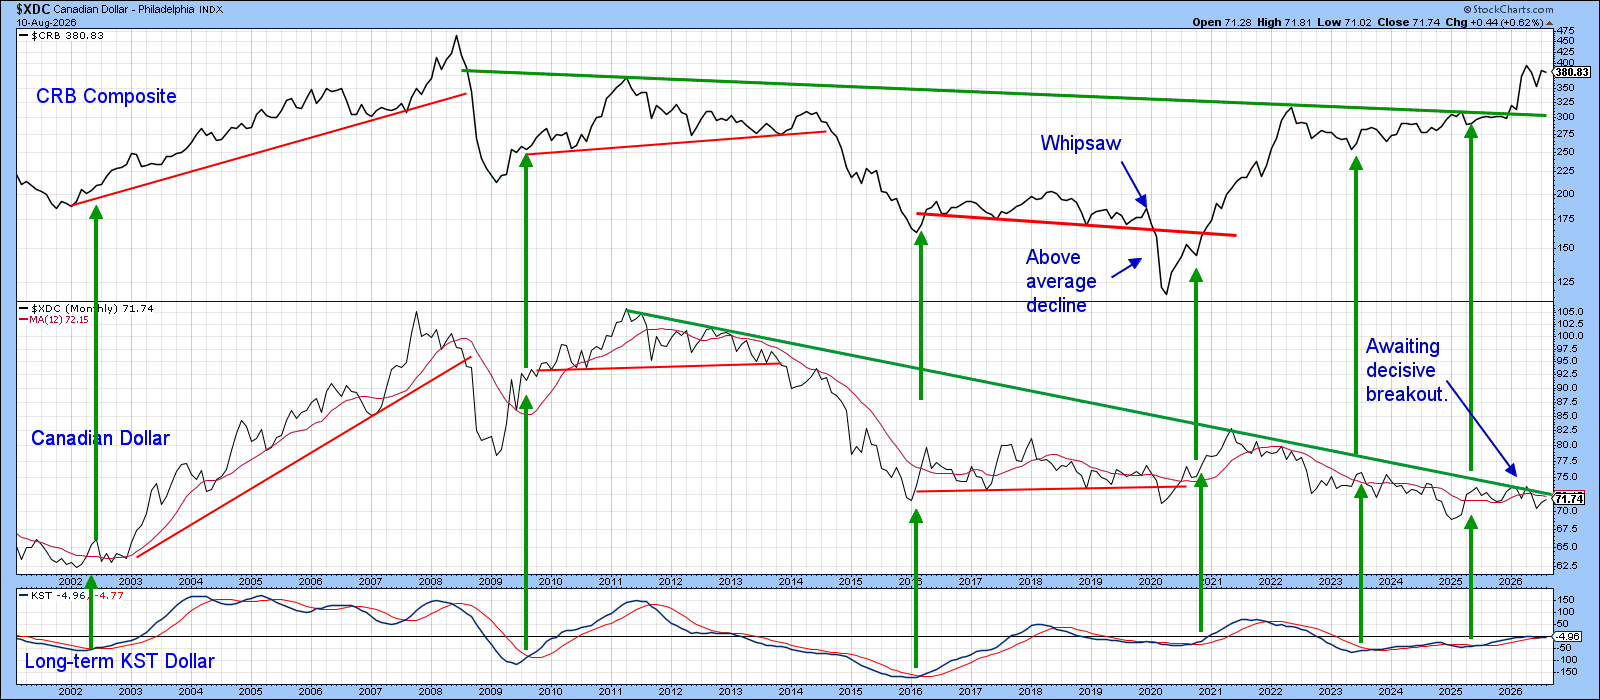
Chart 5 shows the link between commodity prices and the Canadian dollar. When the KST gives a buy signal for the CAD, commodities often rise. Right now the CAD sits at a technical crossroads.
If the CAD jumps above its long‑term downtrend, it would send a strong buy signal and raise chances of another commodity rally.
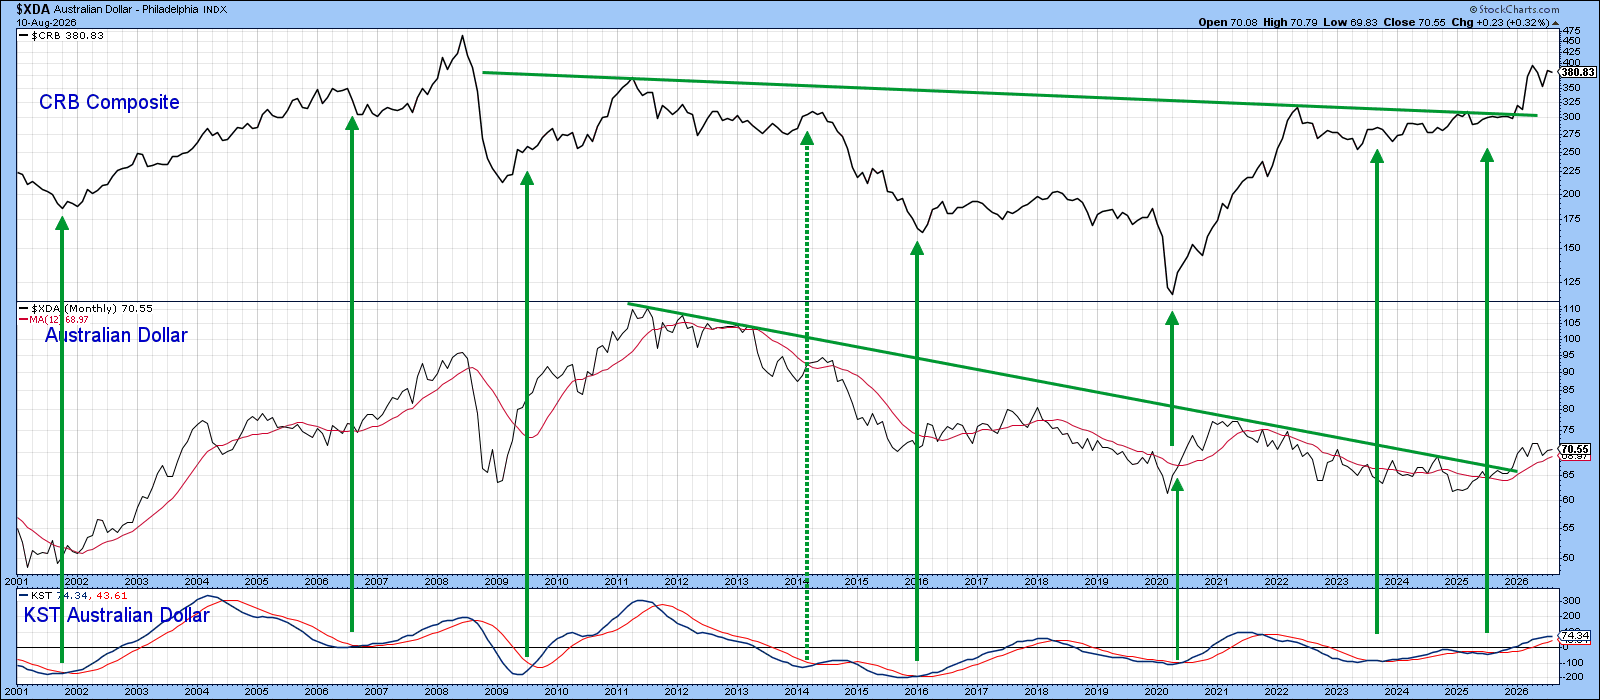
The Australian dollar, which behaves like the CAD, already broke above its downtrend and gave a bullish signal (see Chart 6). If the CAD follows, it adds another hint that commodities may still have room to rise.
Bottom Line
Technical signs mostly point up for commodities, but watch the key support and resistance levels from Chart 1. A clear break either way will tell us the next big move.
Source: Materials provided by https://articles.stockcharts.com.Note: Content may be edited for style and length.