

The S&P 500 has slipped for two months in a row, but the loss was small – about 1% in June and barely 0.1% in July. August and September are known for extra market wobble, so investors are watching closely.
Last summer, a weak July jobs report rattled Wall Street and even sparked political drama. The job numbers later helped the Federal Reserve pause its rate cuts. Two years ago, a sudden unwind of a yen‑carry trade sent shock waves across stocks, bonds and currencies, followed by more Fed easing.

What July’s Job Numbers Might Do
This week ends with the July payroll report. Economists don’t expect big surprises, but the data could still shift market mood. So far, the economy looks steady: oil prices have dropped, corporate earnings are soaring thanks to AI and other tech gains, and many stocks are showing strong breadth.
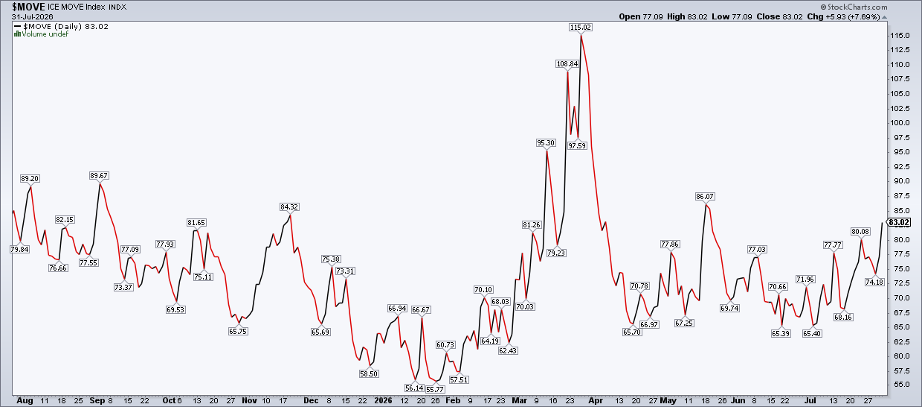
On the downside, credit spreads for lower‑rated bonds are widening and bond sellers are active. After the latest Fed meeting, Treasury yields moved higher, and the ICE BofA MOVE Index – a gauge of rate‑change anxiety – rose to its highest level since May.
The Dollar’s Sudden Turn
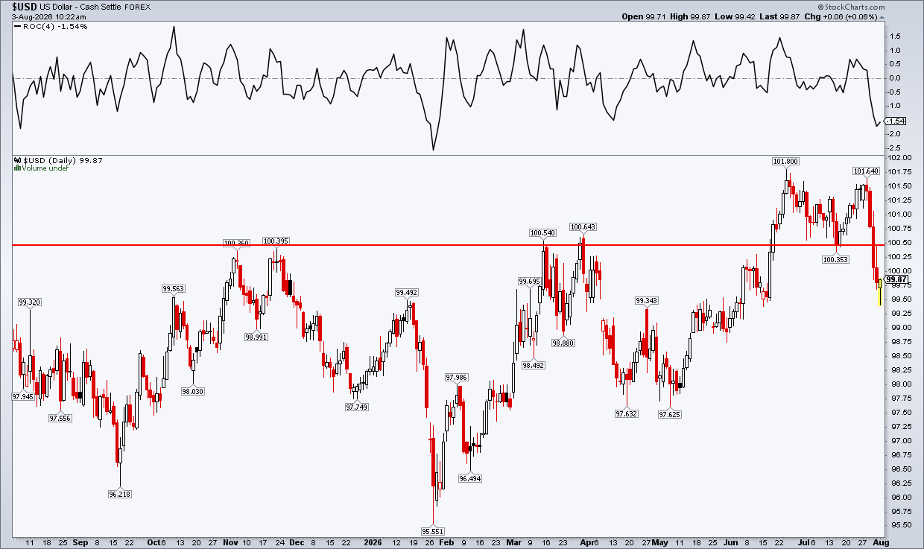
Traders usually look at stocks, bonds, commodities and currencies together. The U.S. Dollar Index was climbing fast until late July, then fell about 1.6% in four days, slipping below the 100.3‑100.6 range.
Mixed signals from Fed Chair Powell and Japanese intervention in the USD/JPY pair helped the dollar drop to 99.42 before bouncing back. Watching the dollar will be important for the rest of the year.
Small‑Cap Stocks Lose Some Steam
The Russell 2000 ETF (IWM) almost avoided a fifth straight down week, but the overall trend for U.S. small‑caps is still soft. IWM peaked at $302.72 on July 1 and has drifted down to around $288 after the Fed’s July decision.
The chart shows a bull‑flag pattern that is getting longer, which often turns bearish. The price is hovering around the 50‑day moving average, another sign of a shaky near‑term direction.
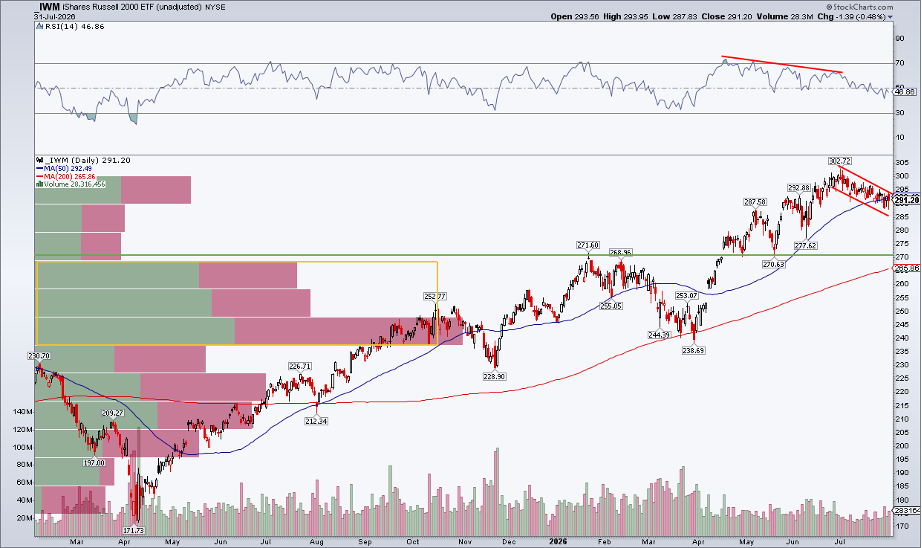
The RSI oscillator is showing a mild negative divergence – the indicator is making lower highs while the price made higher ones earlier in the year. The RSI is still above 40, so the sell pressure isn’t extreme.
Support near $270 looks solid; it was a key level in January and again in May. The 200‑day moving average will soon line up with that area, adding extra strength.
International Stocks Sitting Still
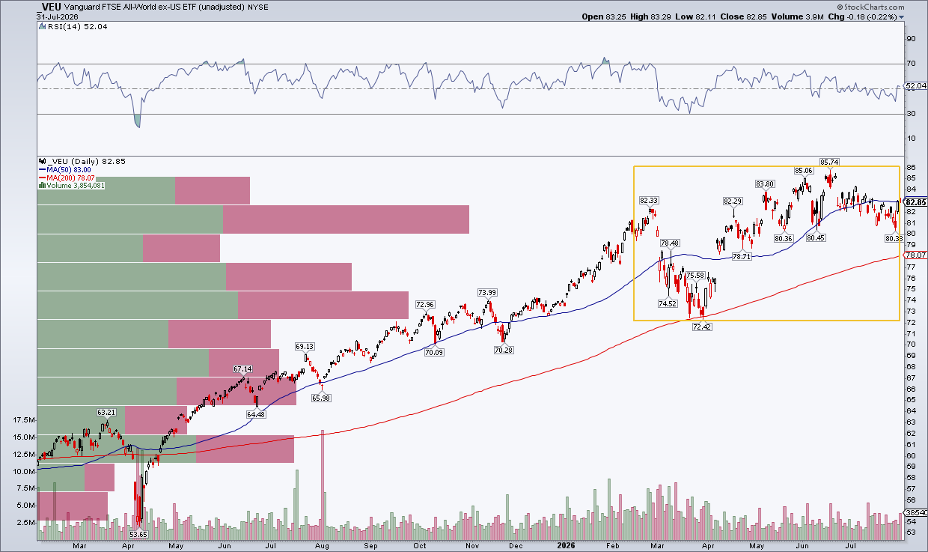
Outside the U.S., the Vanguard FTSE All‑World ex‑US ETF (VEU) has been flat since February. The lack of a clear trend could mean the market is pausing before a bigger move, or it could be a sign of distribution.
Volatility often rises in October, so the next few weeks may reveal the direction. Keeping some cash on hand could be a sensible safety net.
Bottom Line
June and July did not give a clear edge to bulls or bears. Large‑cap and small‑cap U.S. stocks are moving sideways as we head into a tricky calendar stretch. Bonds stay weak, oil is making lower highs, and the dollar’s breakout looks doubtful.
Some areas, like equal‑weight S&P 500 stocks, value names, and a few China‑related equities, still show strength. A cautious, risk‑aware stance is probably wise for the next couple of months.
Disclaimer: This article is for educational purposes only and does not constitute financial advice. Always consider your personal financial situation and consult a professional before making investment decisions.
Source: Materials provided by https://articles.stockcharts.com.Note: Content may be edited for style and length.