


The big U.S. stock indexes all slipped below the levels many traders call support. When prices fall under support, the next downside targets become very important.
Technology shares, especially chips, fell the most. The drop happened after the Federal Reserve’s meeting, while oil prices rose and tension with Iran grew.
Before the Fed announcement, stocks fell until around 12:30 p.m. ET, then they tried to climb back. Gold went higher and the U.S. dollar slipped, which lifted the euro, pound and yen.
That brief bounce made it look like the market might rally, and for a short time the S&P 500 and Nasdaq did move into positive territory. The rally was short‑lived, however, and all three major indexes closed lower.
- S&P 500: 7,316.15 (-1.52%)
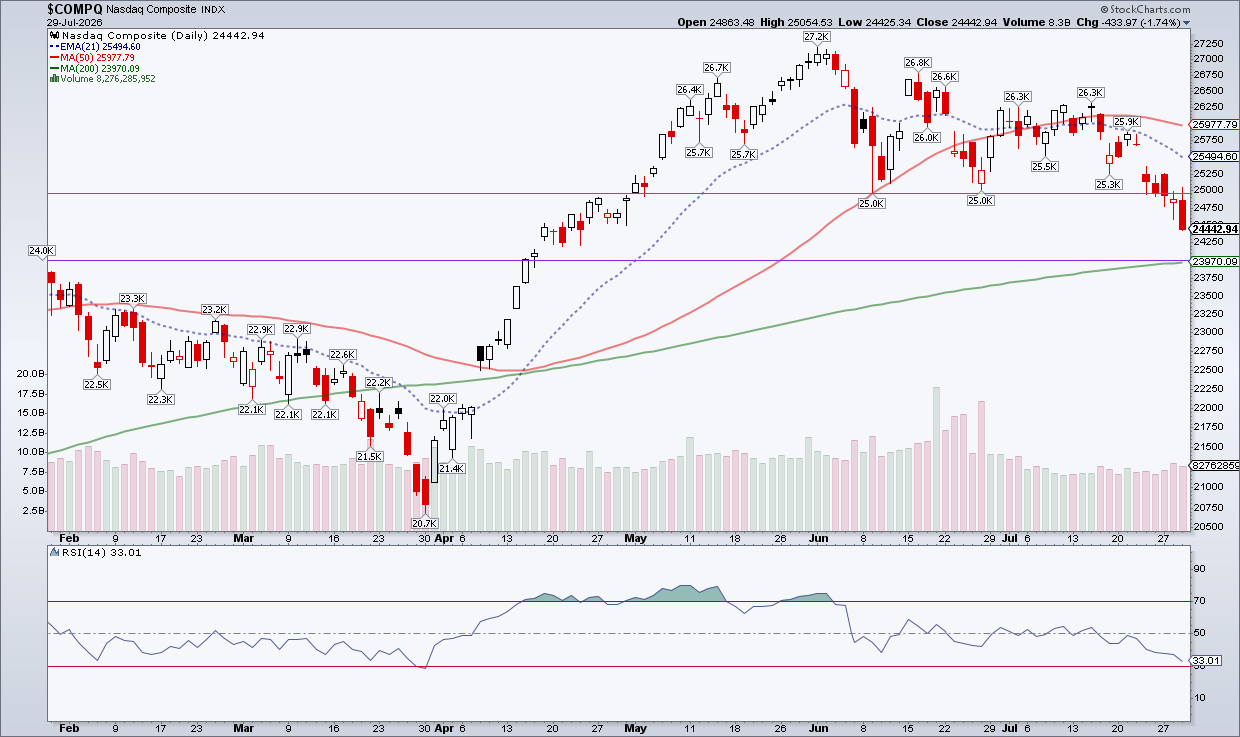
- Nasdaq Composite: 24,442.94 (-1.74%)
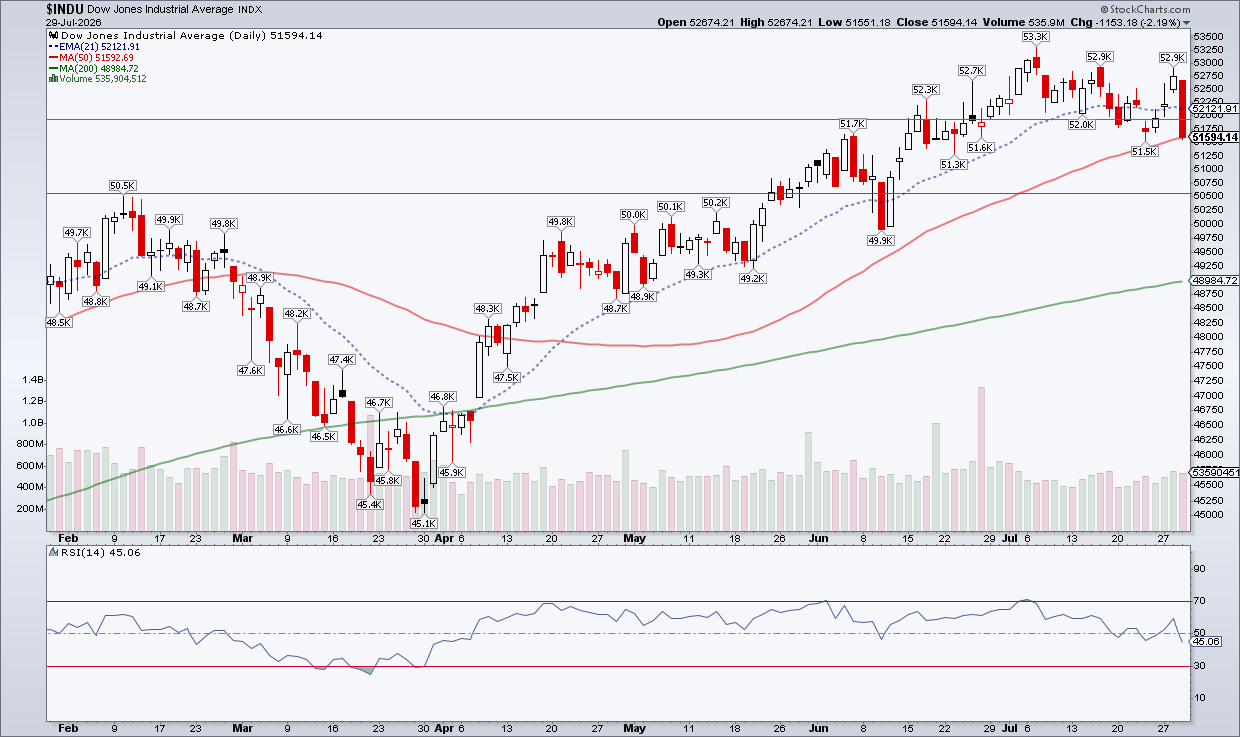
- Dow Industrials: 51,594.14 (-2.19%)
Each index is now below its first key support level. On the weekly charts the next important support points are:
- S&P 500 around 7,236
- Nasdaq near 24,000 (its 200‑day simple moving average)
The Dow looked a bit stronger because it stayed above a short‑term trend line, but that line broke on Wednesday. The index fell to its 50‑day moving average. The next level to watch is around 50,560.
To see how big the sell‑off was, look at the Nasdaq. The chart below marks its next key support line (the 200‑day moving average) on a daily view.
Tech stocks led the decline. Semiconductor shares were hardest hit, with the VanEck Semiconductor ETF down about 4.8%. Software stocks held up better; the iShares Expanded Tech‑Software ETF rose slightly. Microsoft and Meta reported earnings after the market closed – Meta fell, while Microsoft edged higher.
Other Markets Joined the Slide
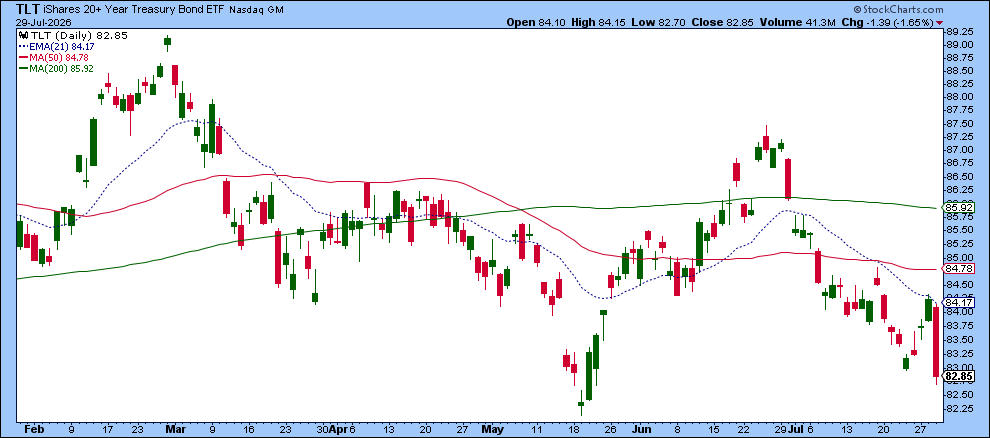
Bonds also fell. The iShares 20+ Year Treasury Bond ETF dropped 1.65% and is close to its May low of 82.14.
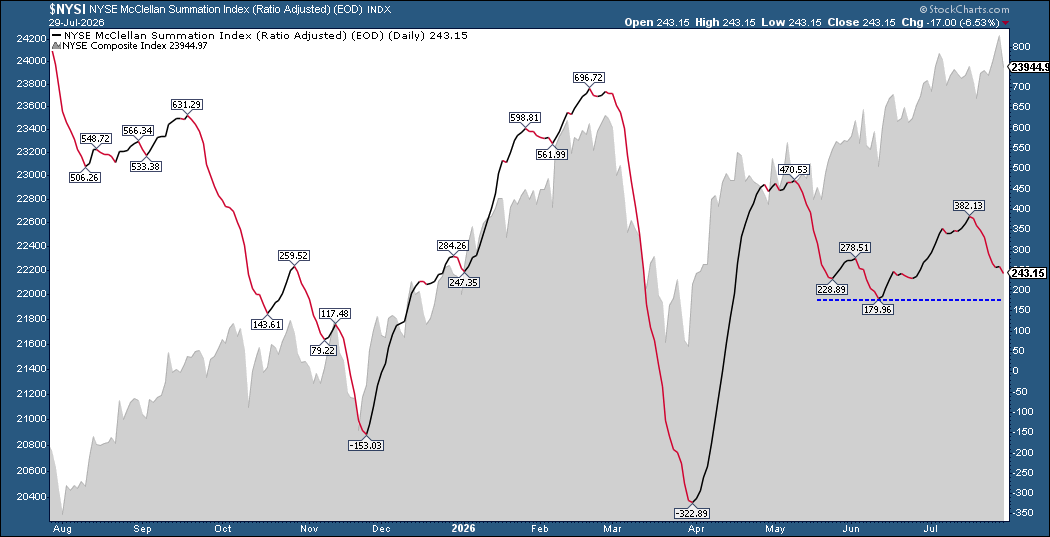
Overall, the picture isn’t bright for bulls. Breadth indicators such as new highs vs. new lows, advancing‑declining issues, and the McClellan Summation Index are still mixed. More than half of S&P 500 stocks stay above their short‑term moving averages, and the McClellan Index has not yet fallen to its June low.
The most worrying sign is where the major indexes sit relative to their support lines. Watching how they behave at those levels will tell us if we are just seeing a pull‑back or a deeper reversal.
Volatility is also rising. The CBOE VIX closed at 20.66 on Wednesday, a sign that traders expect more swings.
What to Expect Tomorrow
Thursday brings the Personal Consumption Expenditures (PCE) report, the Fed’s favorite inflation gauge. Earnings from Alphabet and Amazon will also be released.
With indexes under short‑term support, mixed earnings, higher oil prices, and geopolitical tension, market uncertainty is higher than usual. Pay close attention to price action at key support levels and see if breadth indicators line up. That will help you decide whether the market is merely correcting or heading for something bigger.
Disclaimer: This article is for educational purposes only and does not constitute financial advice. Always consider your personal situation and consult a professional before making investment decisions.
Source: Materials provided by https://articles.stockcharts.com.Note: Content may be edited for style and length.