

July has been rough for technology stocks. The big tech ETFs are falling fast, and the month isn’t over yet. Big earnings reports from the "Magnificent Seven" and the Fed’s latest rate decision could change the picture, but for now the Technology Select Sector SPDR ETF (XLK) is on track for its worst month since September 2022.
Historically, July is a good month for tech. In the last 16 Julys, XLK was up 15 times. This year it is down about 10%, the biggest drop since 2022. The decline started before the earnings reports from Microsoft, Meta, Apple and Amazon, and the fund fell to its lowest level since early May.
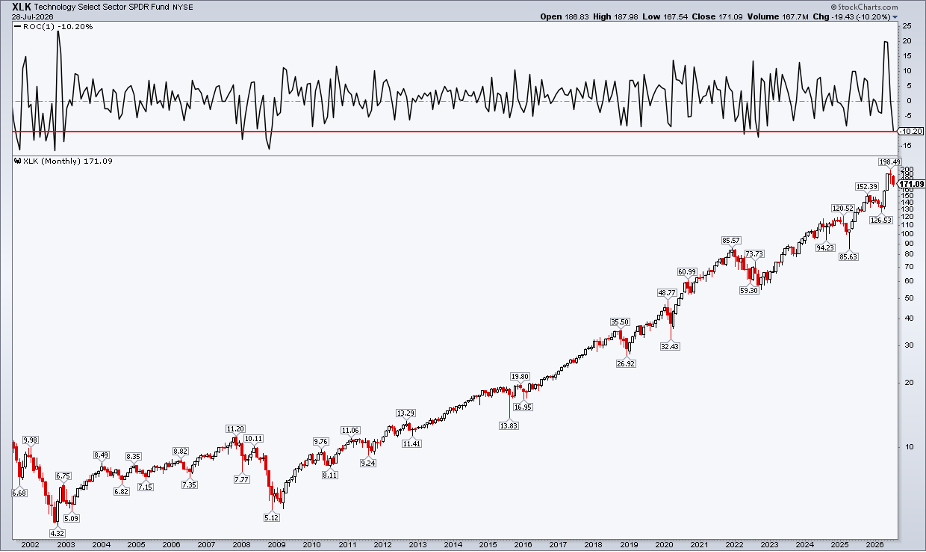
Tech’s summer slump is spreading. ETFs that focus on South Korea (EWY) and Taiwan (EWT) have taken hits. The Roundhill Memory ETF (DRAM) fell sharply, and the Philadelphia Semiconductor Index ($SOX) may log its biggest monthly loss since 2001. Even the SpaceX IPO (SPCX) fell about half in six weeks.
Value Takes the Wheel
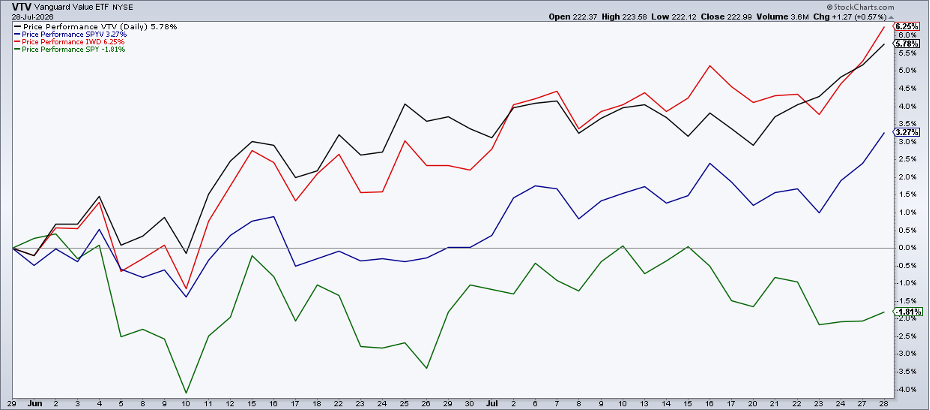
Style is shifting. Growth‑focused funds are losing ground, while value‑focused ETFs are climbing. Since June, the iShares Russell 1000 Value ETF (IWD) is up 6.3%, Vanguard Value ETF (VTV) is up 5.8%, and SPDR S&P 500 Value ETF (SPYV) is up 3.3%. The overall S&P 500 ETF (SPY) is down 1.8% on a total‑return basis.
Growth ETFs like IWF, VUG and SPYG are down 8.8%, 6.9% and 5.9% respectively. As the biggest tech caps stumble, the charts hint that value could keep delivering gains.
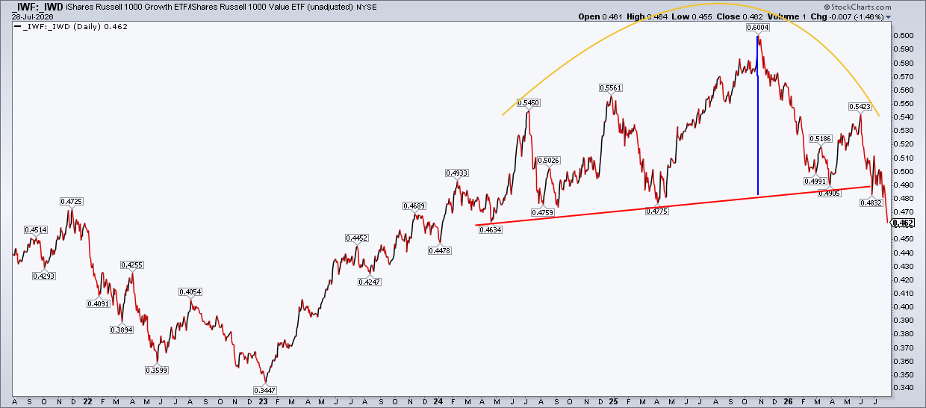
The Ratio Flashing a Growth Warning
The IWF:IWD ratio (U.S. growth vs. U.S. value) fell to its lowest level since January 2024. The chart shows a head‑and‑shoulders pattern, which often means more downside may follow. The exact price target isn’t the main point – the signal is that “real‑economy” stocks may hold up better than high‑growth tech.
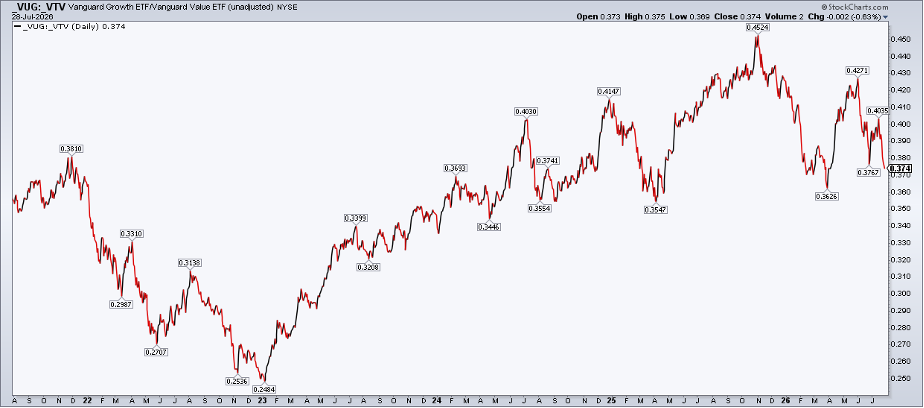
Look for Confirmation
Traders look for more clues. The VUG:VTV and SPYG:SPYV ratios also show mixed signals. Vanguard’s VUG:VTV chart has support around 0.35‑0.37, but a rounded‑top pattern is visible. Meanwhile, the SPYG:SPYV ratio still leans higher for growth.
Don’t Give Up on Growth Yet
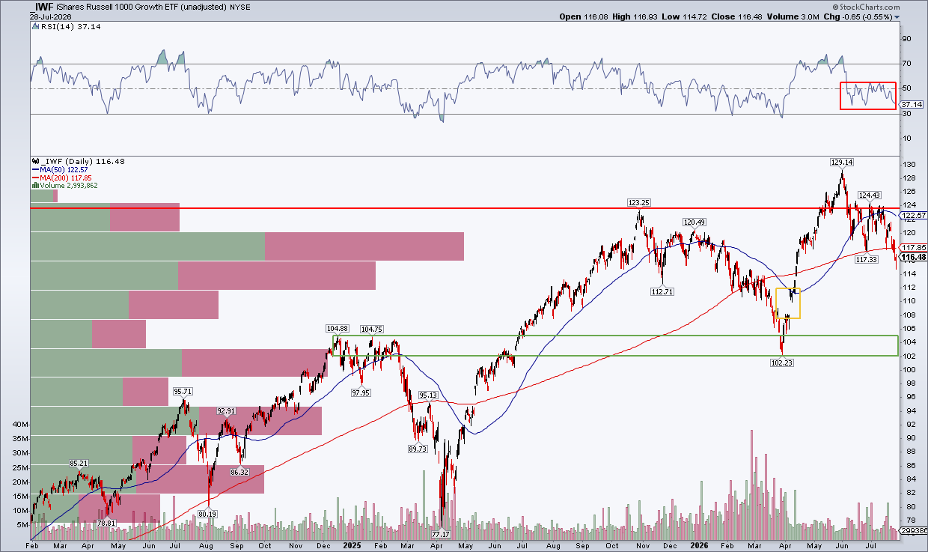
Growth stocks aren’t dead. One key price level for the iShares Russell 1000 Growth ETF (IWF) could change the story. A gap opened on April 8 at $108. Prices often close such gaps. IWF fell below its 200‑day moving average and has been down for five days in a row.
The RSI oscillator is in a weak zone (35‑55), suggesting momentum is low. If volatility rises, IWF could fill the gap, finding support around $102‑$105 (the March low and early‑2024 highs).
Value’s Chart Is Simple… and Strong
Value ETFs are moving straight up. That’s the headline. A deeper look will come later in the third quarter.
Strength Beneath the Surface
Even with big drops in Micron, SanDisk and South Korean stocks, the S&P 500 is still holding near record highs. Sector rotation and style rotation keep the market alive during tough months.
The Bottom Line
Growth vs. value has turned, as the IWF:IWD ratio shows. Other style ratios are not yet sell signals. Watch the $102‑$105 area on IWF for a possible bounce. Overall, the S&P 500 stays afloat, staying close to its all‑time highs.
Disclaimer: This article is for educational purposes only and does not constitute financial advice. Always consider your personal situation and consult a professional before making investment decisions.
Source: Materials provided by https://articles.stockcharts.com.Note: Content may be edited for style and length.