

The VanEck Agribusiness ETF, ticker MOO, is showing clear signs of strength. A recent weekly outside reversal confirmed support, and the fund has bounced off a bullish setup zone. Below we explain what this means and look at how the top holdings are performing.
Most Holdings Are Gaining Ground in 2026
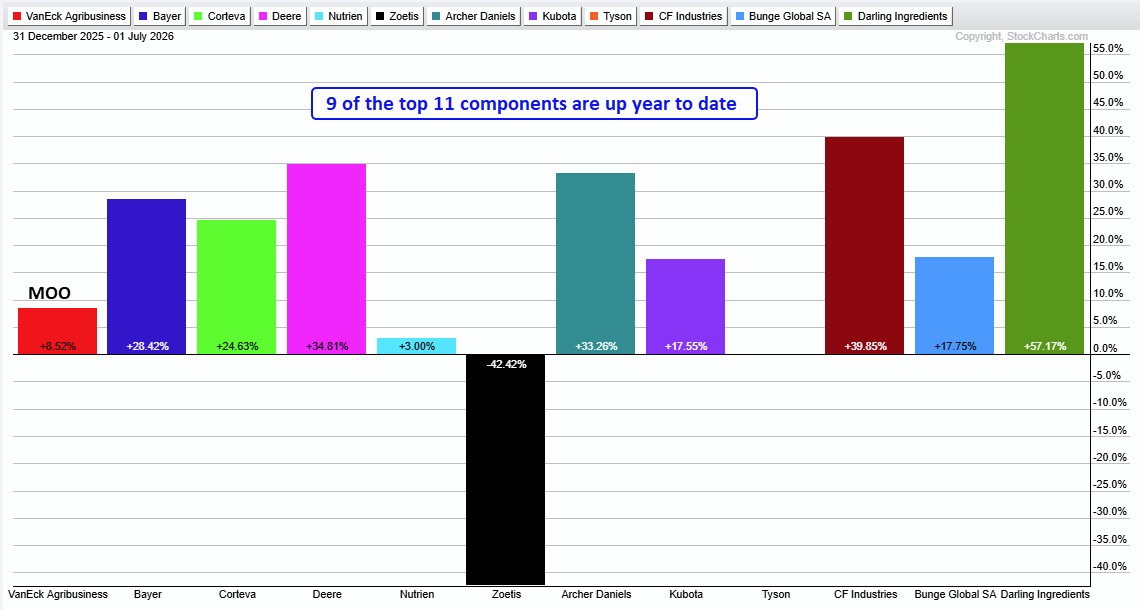
All but two of MOO’s eleven biggest stocks are higher this year. The fund itself is up about 8.5% since the start of the year. Only Zoetis has slipped, while Tyson stayed flat. Overall, the picture is more positive than negative.
Long‑Term Uptrends Dominate the Top Components
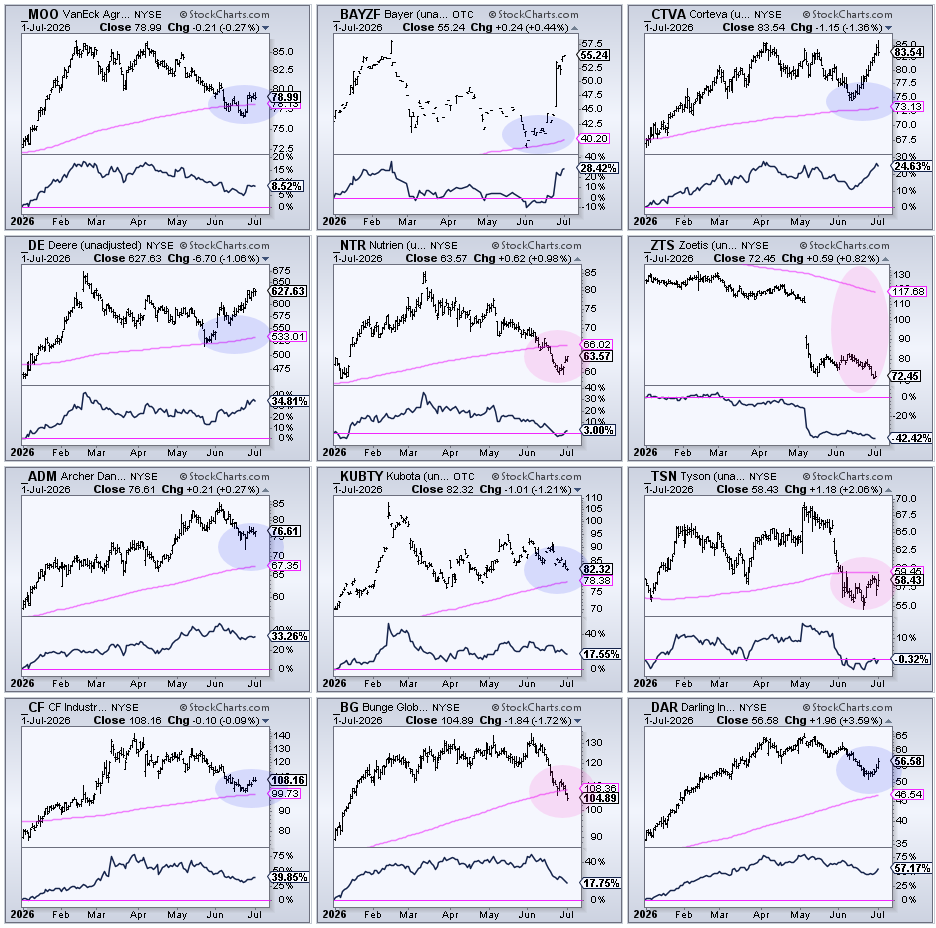
Seven of the eleven leading stocks sit above their 200‑day simple moving averages. Being above this line usually means a long‑term uptrend. This adds confidence to the bullish outlook for MOO.
Weekly Outside Reversal Confirms Support
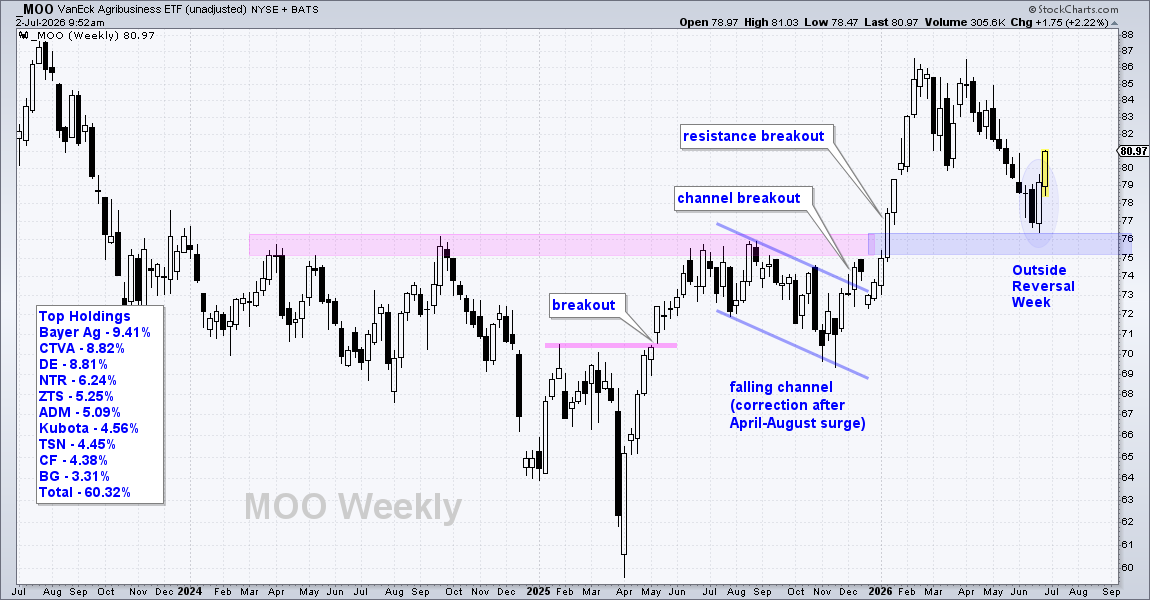
Looking at the weekly chart, MOO broke through a key resistance level at 70 and later topped a 52‑week high. Last week the price fell a little, then closed strongly, creating an outside reversal candle that acts like a new floor of support.
Price is Holding in a Bullish Setup Zone
On the daily chart, the fund is correcting after a long‑term rise. The blue shaded area marks a bullish setup zone, where the 50‑61.8% retracement, the rising 200‑day average, and a prior breakout line up. When price reaches this zone, buyers often step in.
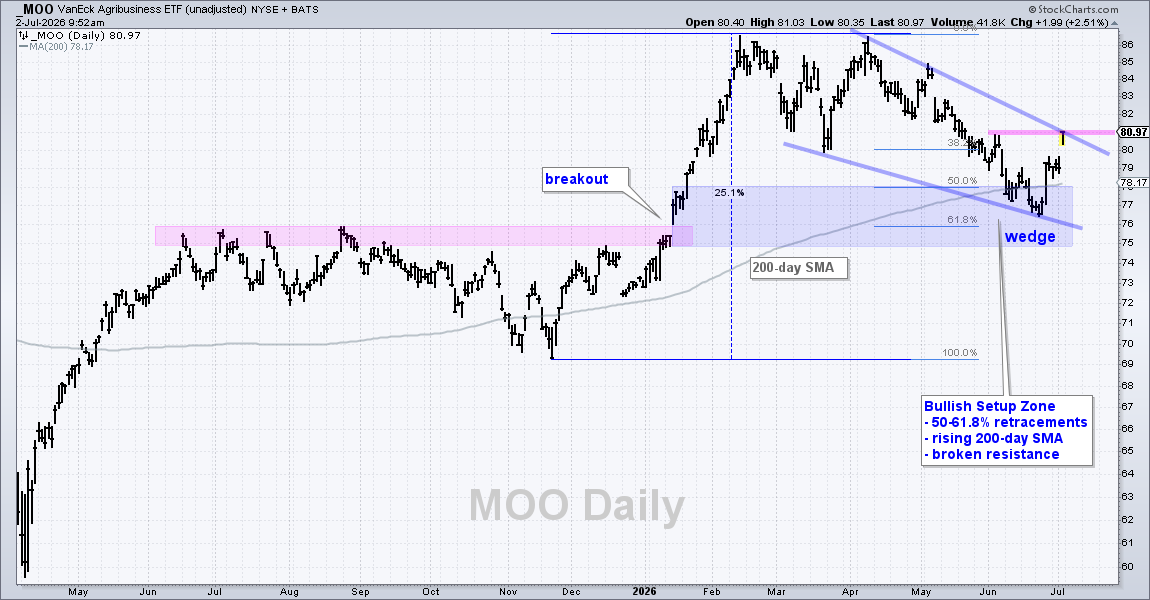
If the price breaks above the resistance line at 81, the falling wedge pattern would be completed and the uptrend could keep going. A close below 76 would make us rethink the picture.
Source: Materials provided by https://articles.stockcharts.com.Note: Content may be edited for style and length.