


Last week the S&P 500 slipped a little over 2 %. The list of the strongest sectors changed a bit. The biggest news is that financial stocks entered the top five and energy fell out.
Top Five Sectors After the Week
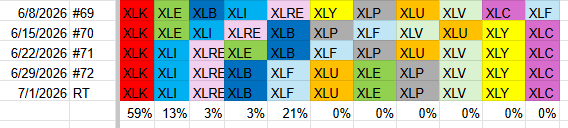
Technology still holds the number‑one spot. It is followed by Industrials and Real Estate. Materials moved up to fourth place. Financials climbed from sixth to fifth. Utilities also improved, jumping to sixth. Energy dropped the most, falling to seventh. Consumer Staples slipped to eighth, and Health Care, Consumer Discretionary and Communication Services stay at the bottom.
- Technology – XLK (59 %)
- Industrials – XLI (13 %)
- Real Estate – XLRE (3 %)
- Materials – XLB (3 %)
- Financials – XLF (21 %)
- Utilities – XLU
- Energy – XLE
- Consumer Staples – XLP
- Health Care – XLV
- Consumer Discretionary – XLY
- Communication Services – XLC
How the Weight of the Top Five Changed
Financials now carry a big slice of the portfolio – about 13 % – which pushes technology’s share down from more than 70 % to 59 %. The shift frees up money so that financials can be overweight in the model.
Weekly Relative Rotation Graph (RRG)
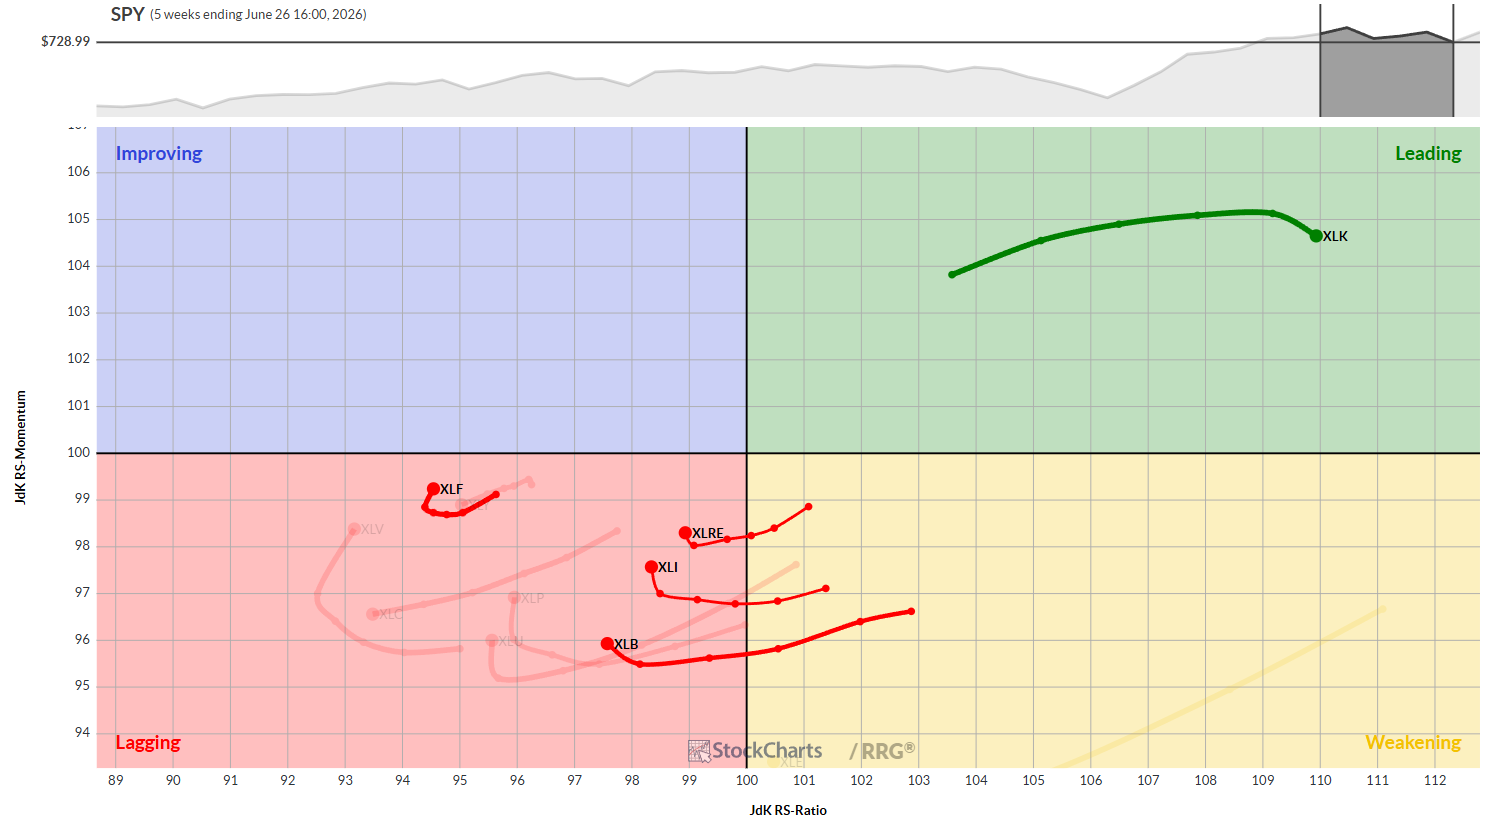
On the weekly RRG, technology is the only sector in the leading quadrant. Most other sectors are in the lagging area. Energy is about to move fully into the lagging quadrant after a recent drop.
Daily Relative Rotation Graph (RRG)
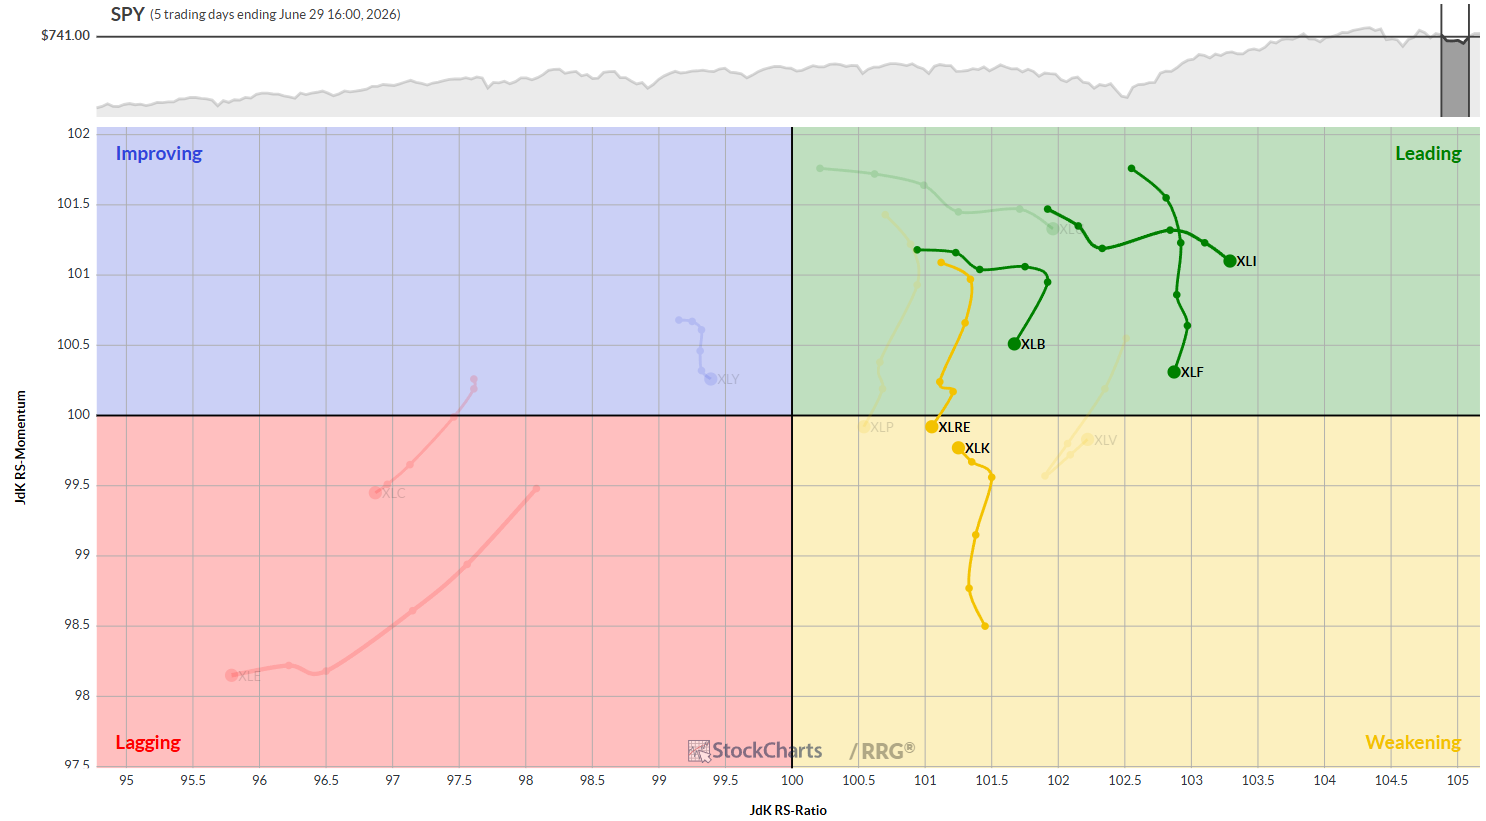
On the daily RRG, all five leading sectors sit on the right side of the chart, showing short‑term up‑trends. Industrials look the strongest. Financials, Materials and Real Estate are losing a little momentum but are still in good spots. Technology is weakening now but is moving back toward leadership.
Sector Highlights
Technology
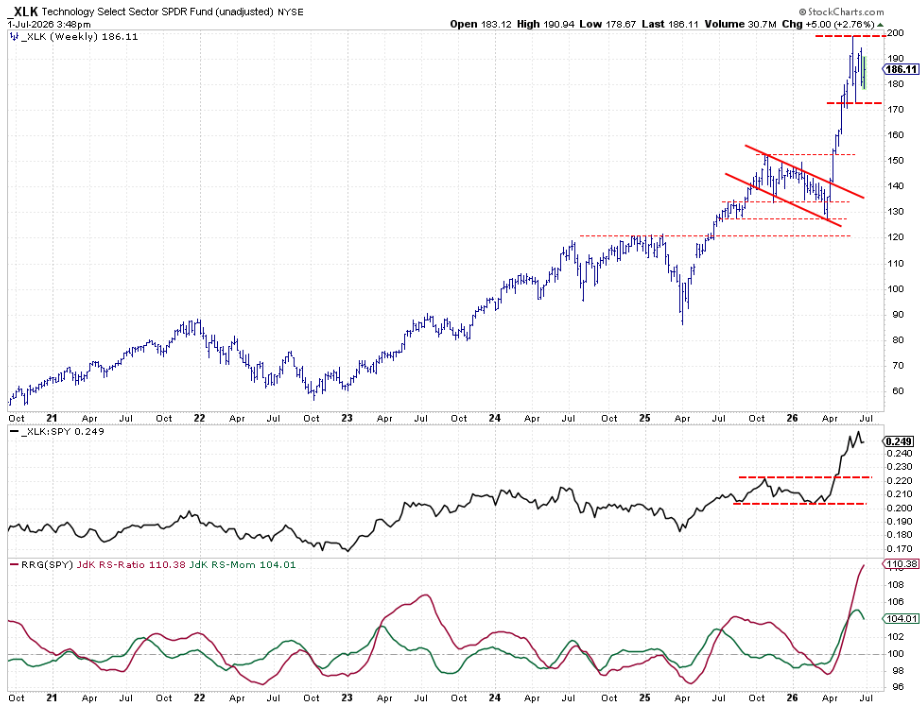
The tech sector is moving sideways, holding the gains from the April rally. Support is near 172.5 and resistance is just under 200. As long as the price stays in this range, the trend stays intact.
Industrials
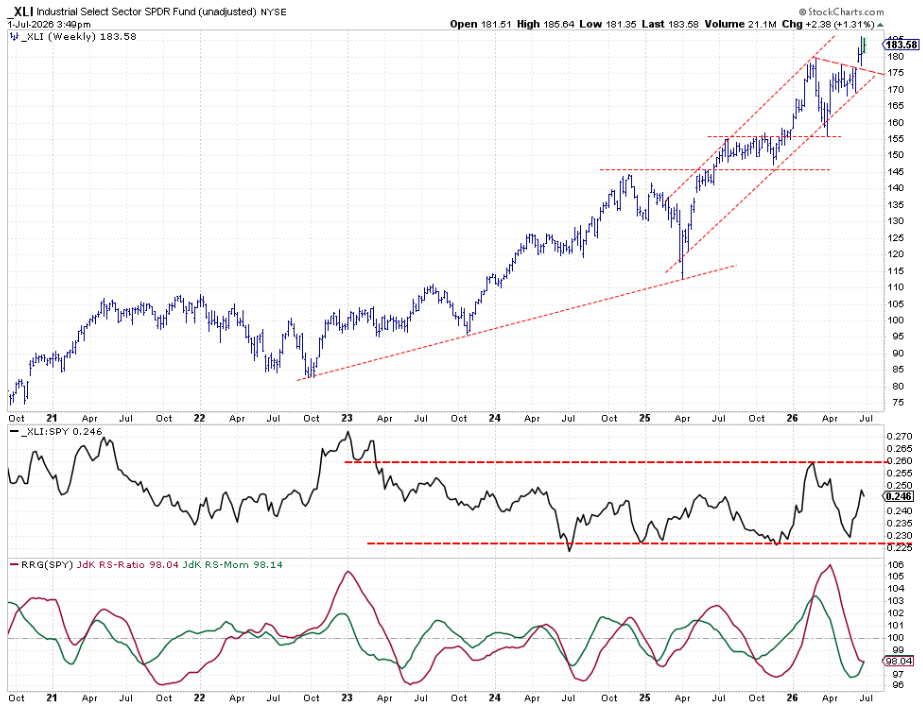
Industrials broke out of a tight range and are now riding a rising channel. The relative‑strength line is climbing, suggesting a mild positive outlook.
Real Estate
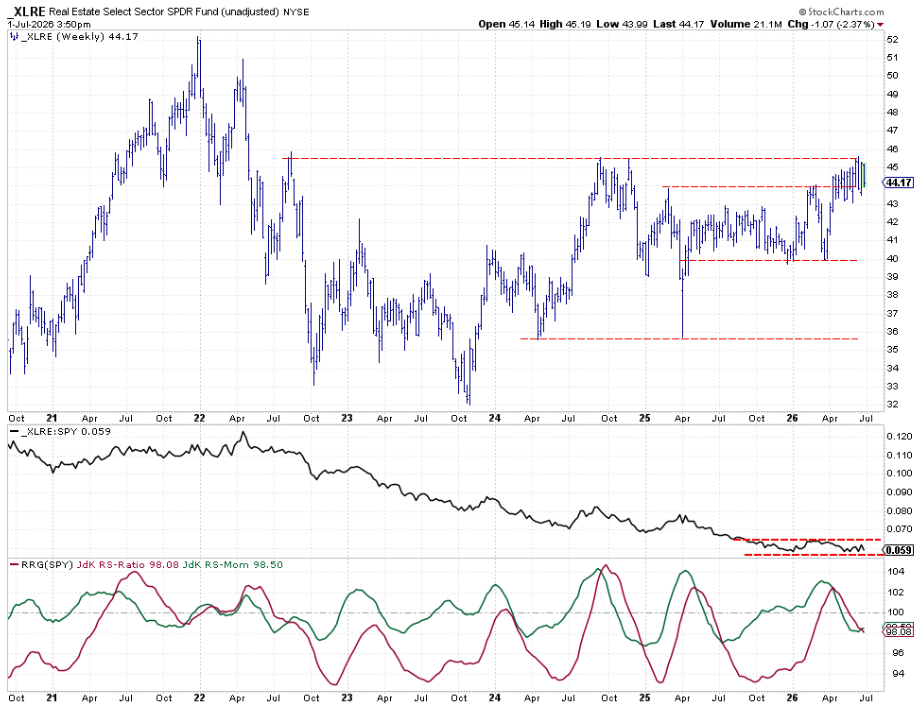
Real Estate is bouncing around a resistance level near 45.5. The long‑term downtrend in relative strength paused, but a breakout is needed to turn the tide.
Materials
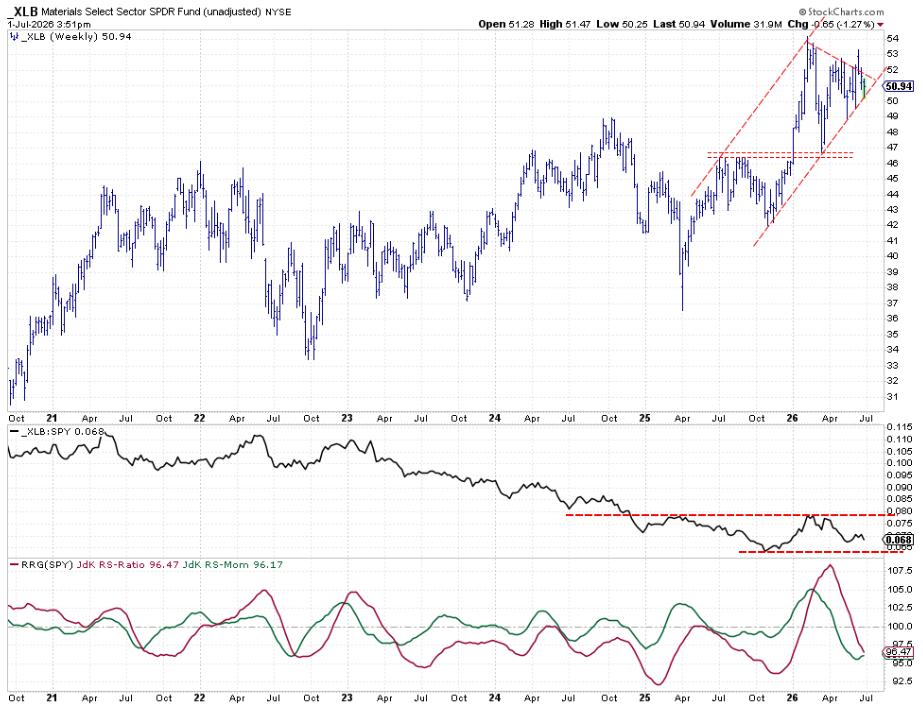
Materials could not keep its breakout from three weeks ago but stays above a rising support line. The sector needs to push past a short‑term resistance to improve its relative strength.
Financials
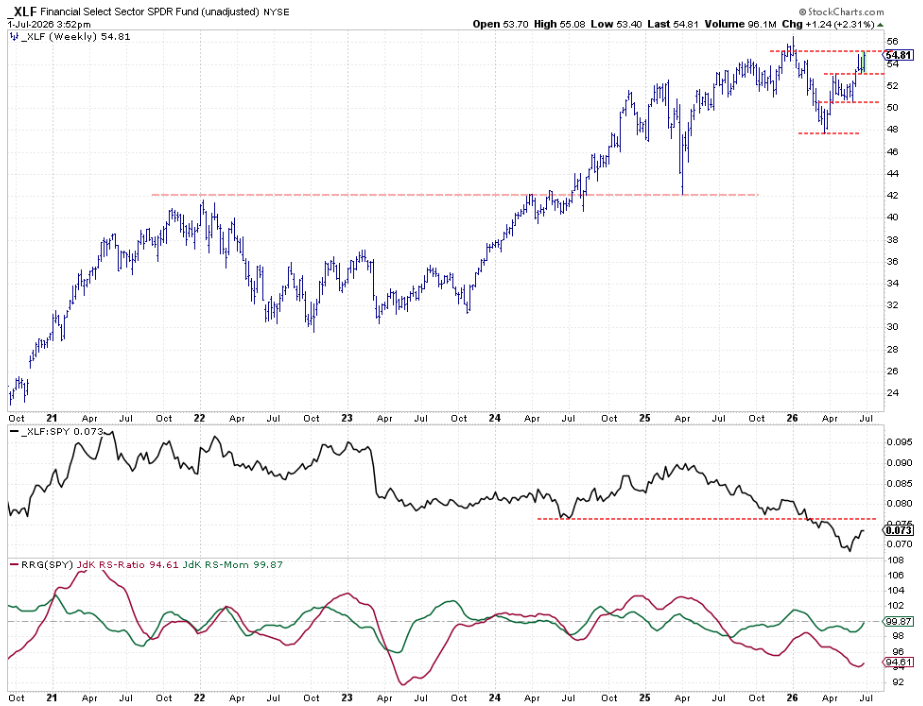
Financials are showing a pattern of higher highs and higher lows. The sector is testing resistance around 55.5‑56. Relative strength is still falling, but momentum is improving. If the momentum line breaks above 100, financials could have the most upside.
Portfolio Performance Update
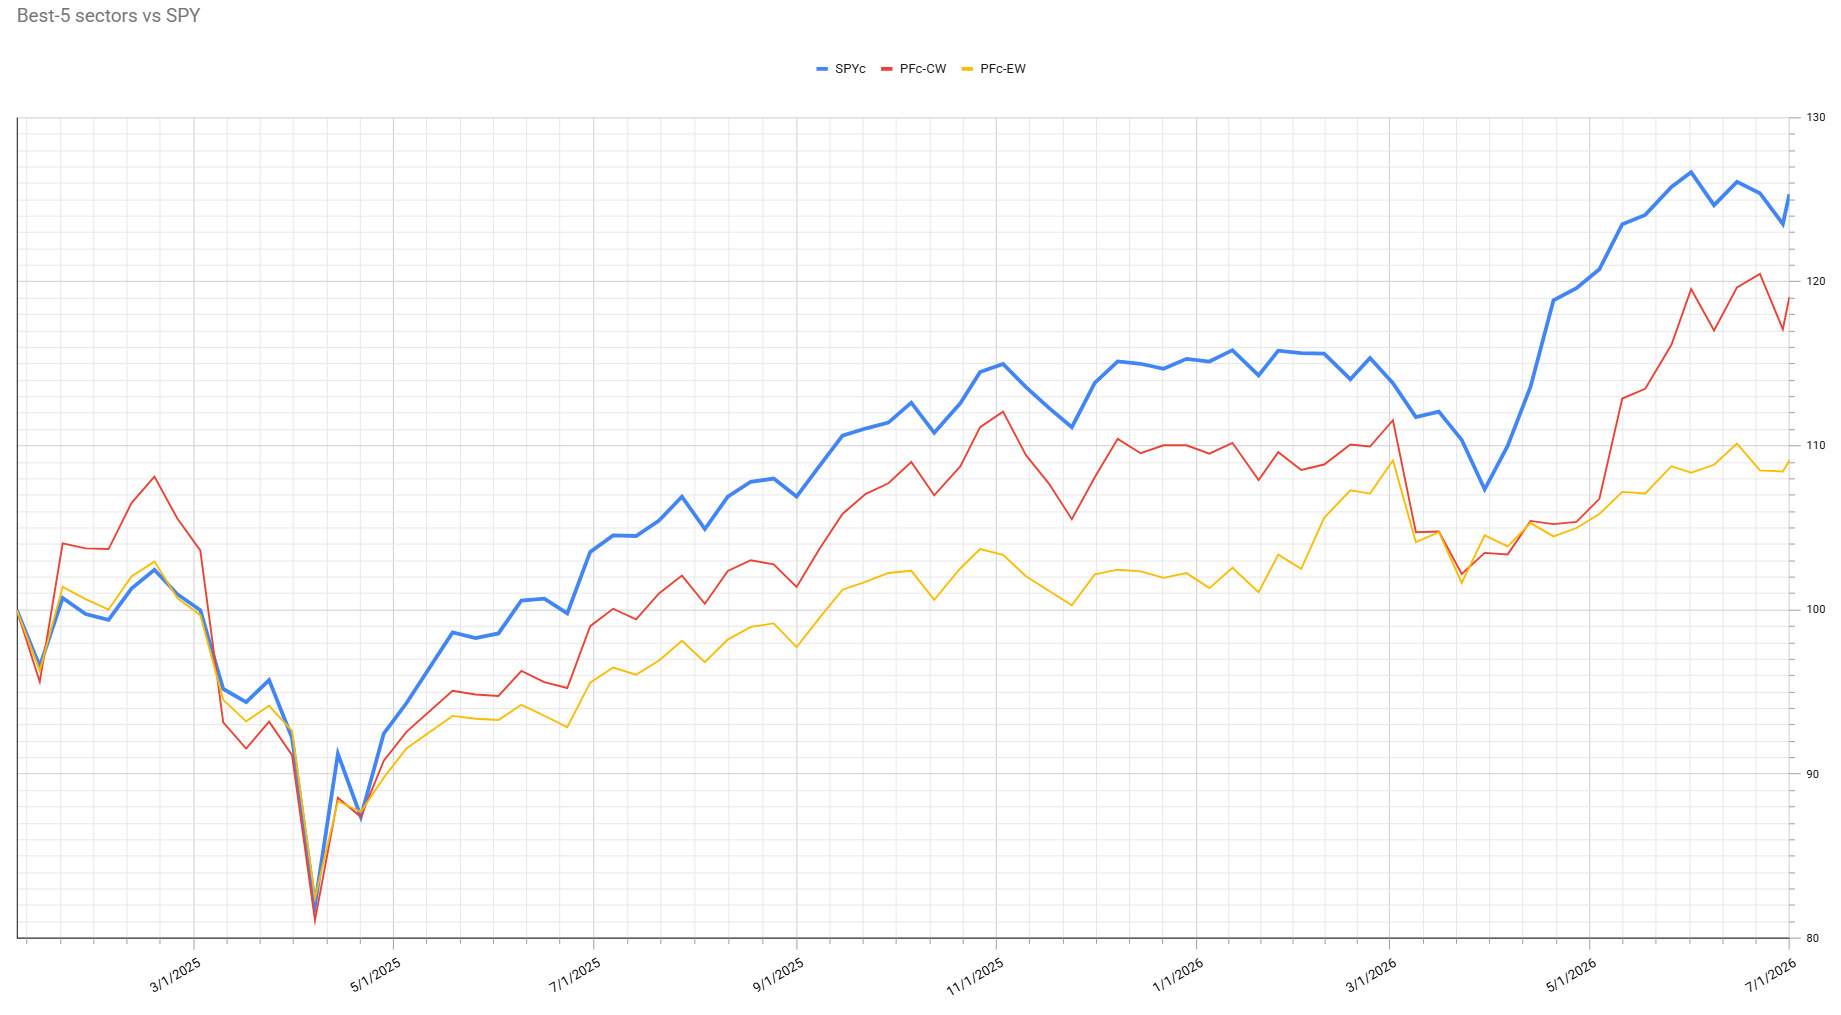
The portfolio’s gap with the S&P 500 widened to a little over 6 % this week, up from just under 5 %. The strategy is getting closer to the benchmark, and it will be interesting to see when it might overtake the index again.
#StayAlert
Source: Materials provided by https://articles.stockcharts.com.Note: Content may be edited for style and length.