


The market started the year strong. Bulls were in charge and held a big lead at halftime.
Tuesday’s close showed the best quarter in six years for the Nasdaq Composite, Nasdaq‑100, S&P 500 and the VanEck Semiconductor ETF. Even though tech stocks felt shaky, the numbers proved they are still healthy.
Semiconductor makers helped lift the whole market. Record shipments from South Korea added to the good mood.
Second‑Half Kickoff
Wednesday was softer. Technology was the weakest S&P 500 sector and the semiconductor ETF fell more than 5 %.
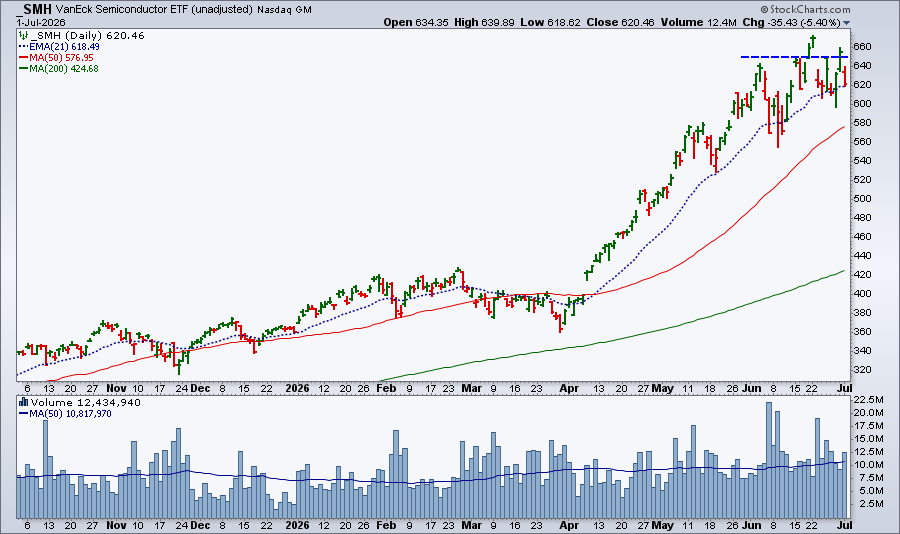
The ETF slipped below 650, a level it crossed in mid‑June, and is now near its 21‑day exponential moving average. Trading volume rose above the 50‑day average, which could be a warning sign.
When we look at all semiconductor stocks, most are green. Large‑cap names led the gain.
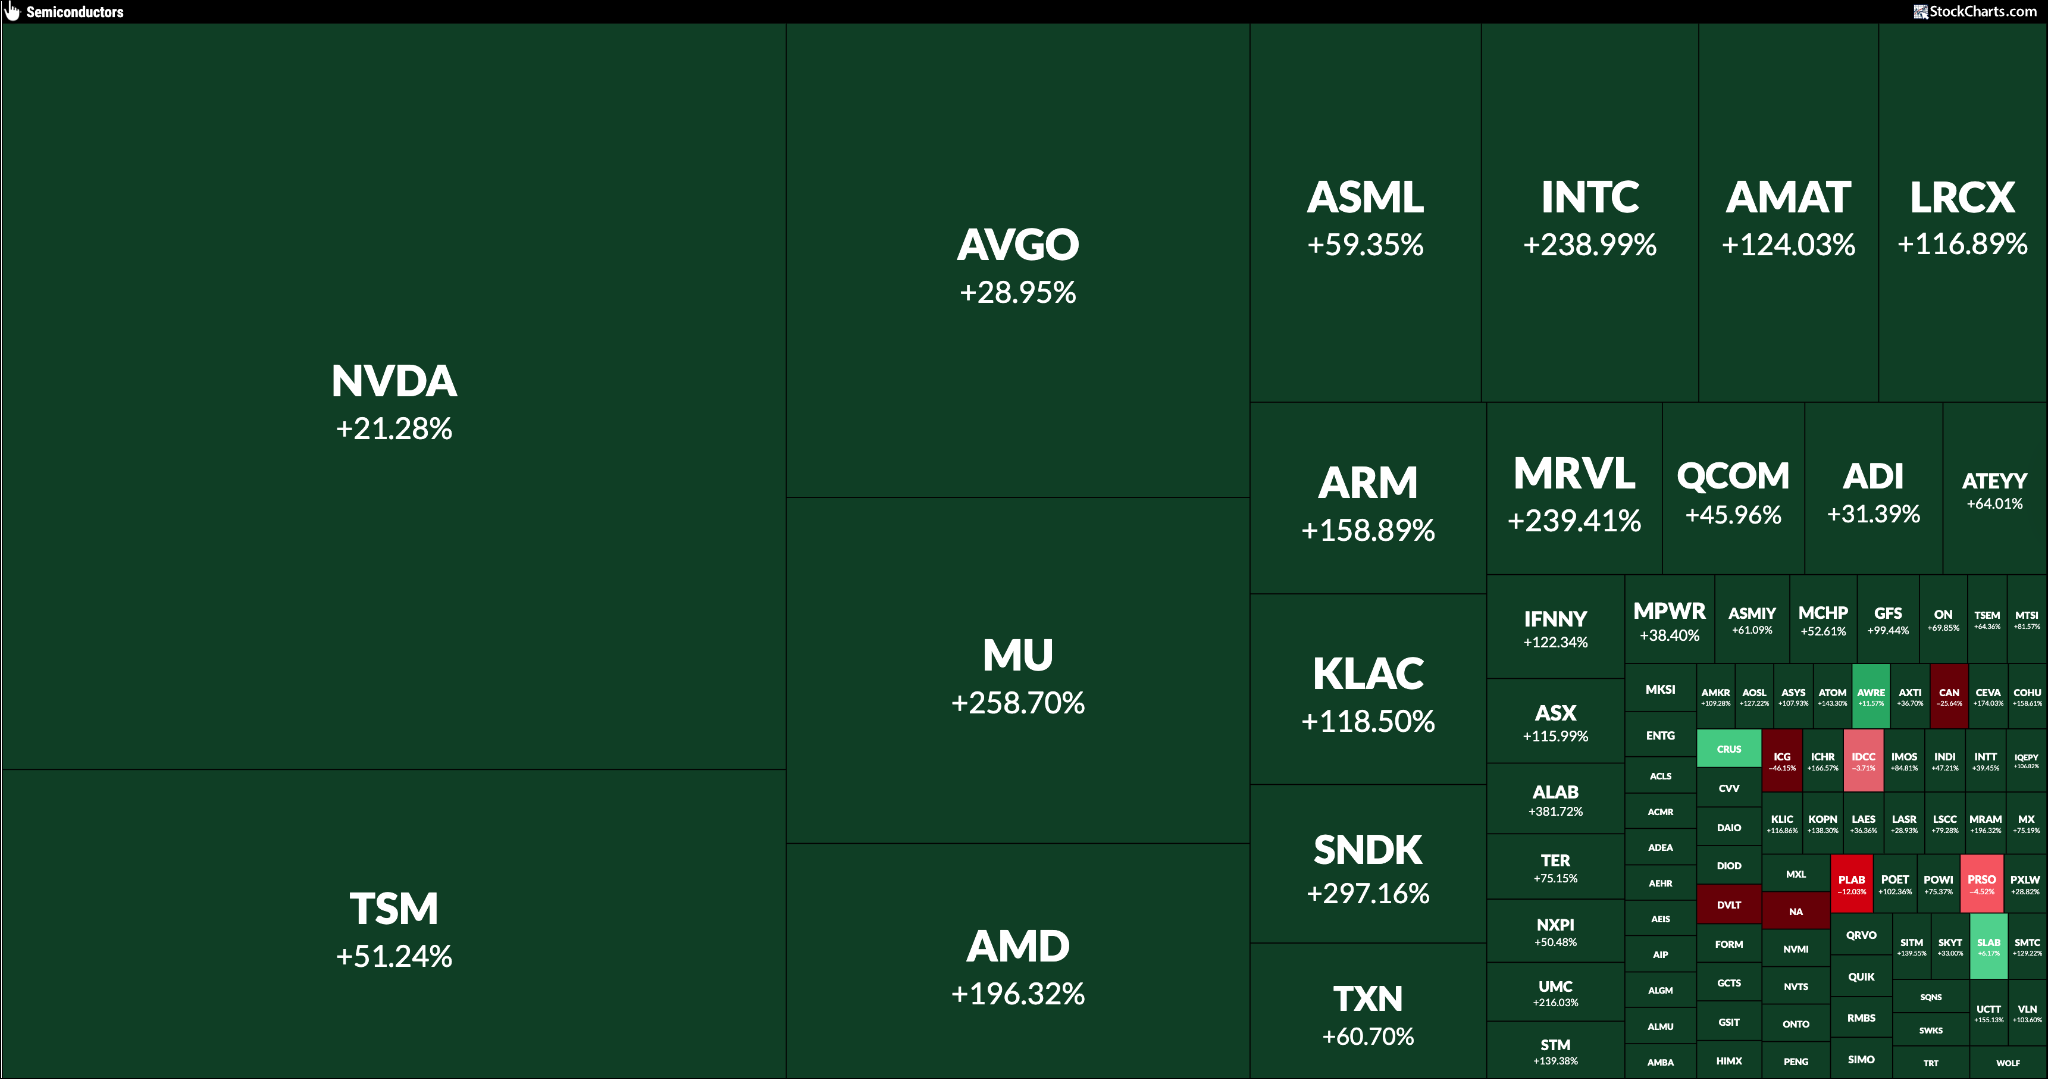
NVDA topped the list with a 21 % rise, but the gain was modest compared with some smaller peers. Red spots were few and limited to lighter stocks.
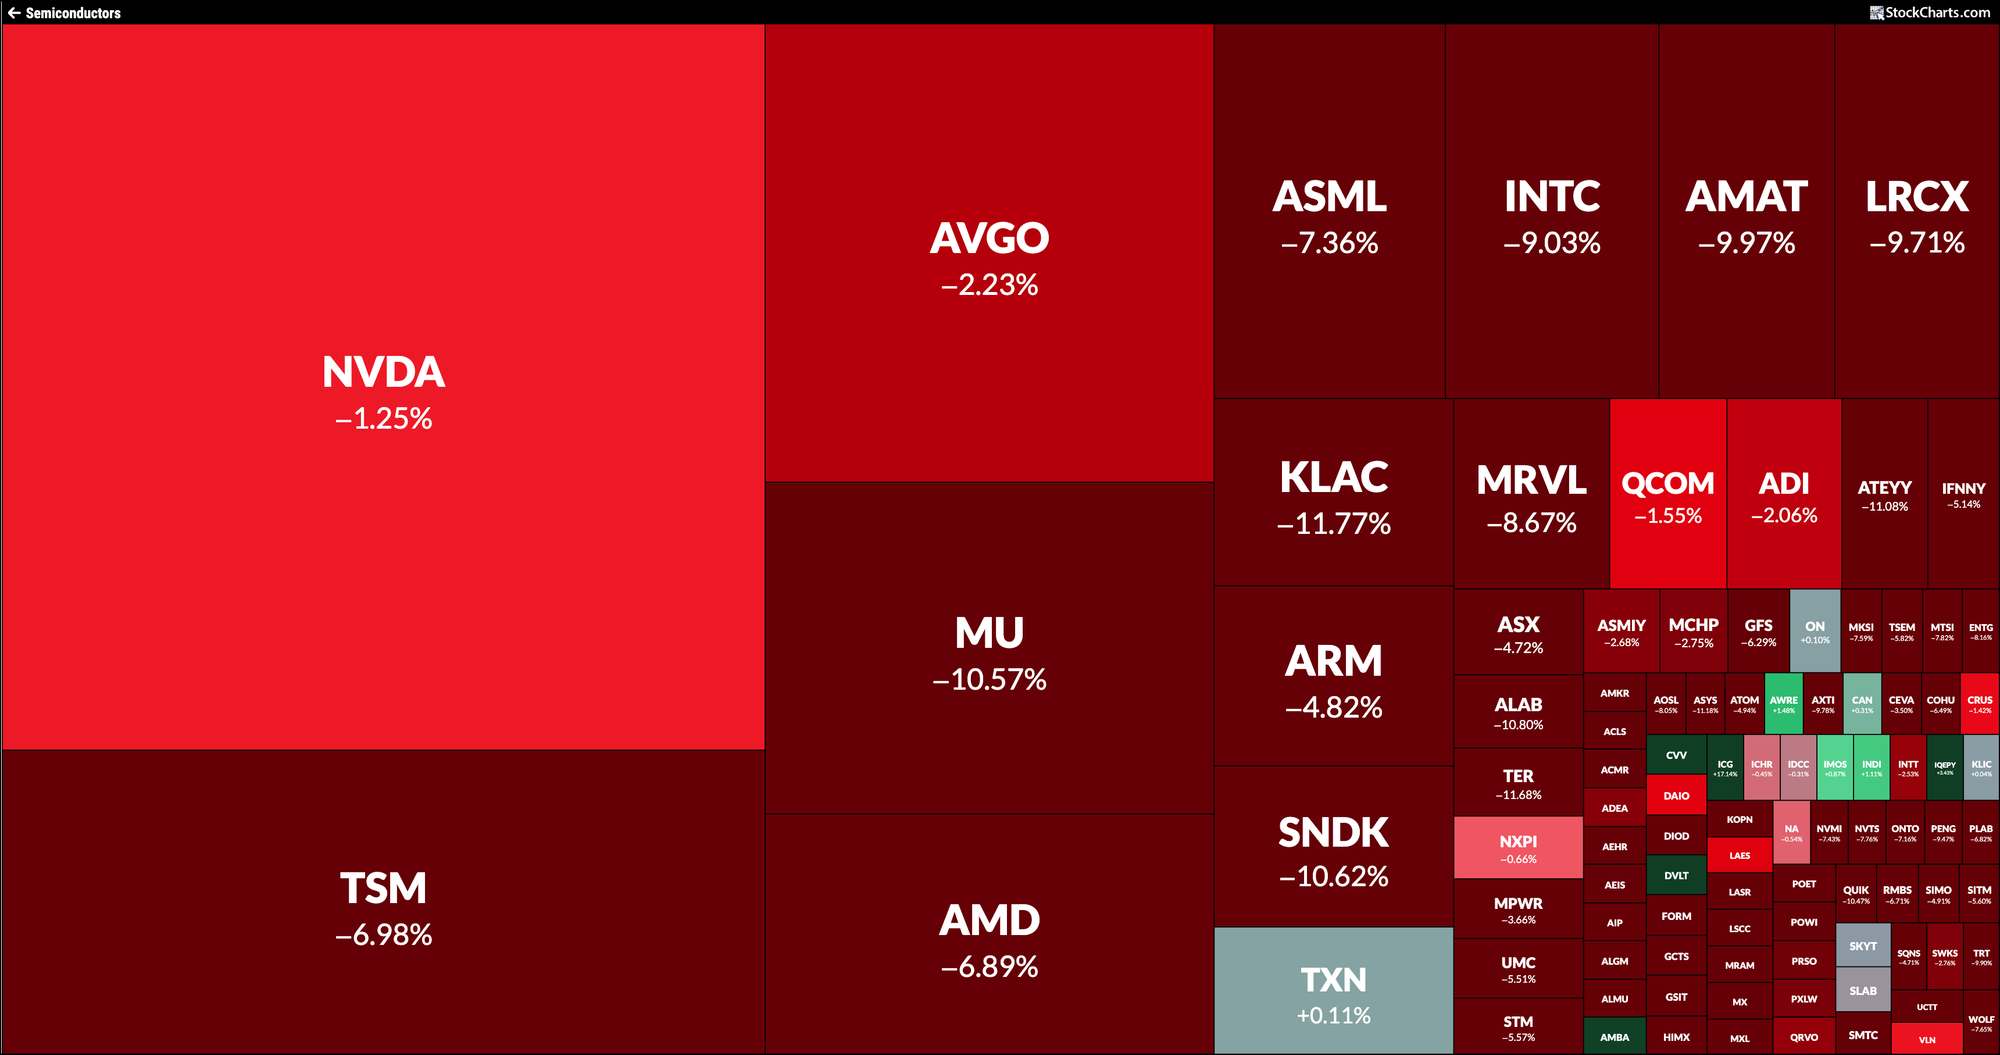
Stocks that lifted the market earlier, like Micron, Intel and Applied Materials, fell hard on Wednesday. If they can hold above their short‑term averages, the dip may become a buying chance.
Other indexes such as the Dow, S&P 600 and S&P 400 closed lower after Tuesday’s record highs, while the equal‑weight S&P 500 ETF hit a new high, showing steady interest in equities.
Overall market breadth stayed neutral‑to‑bullish. New highs outnumbered new lows and sentiment stayed positive. Regional banks led the day’s top‑performing groups.
Outside of Equities
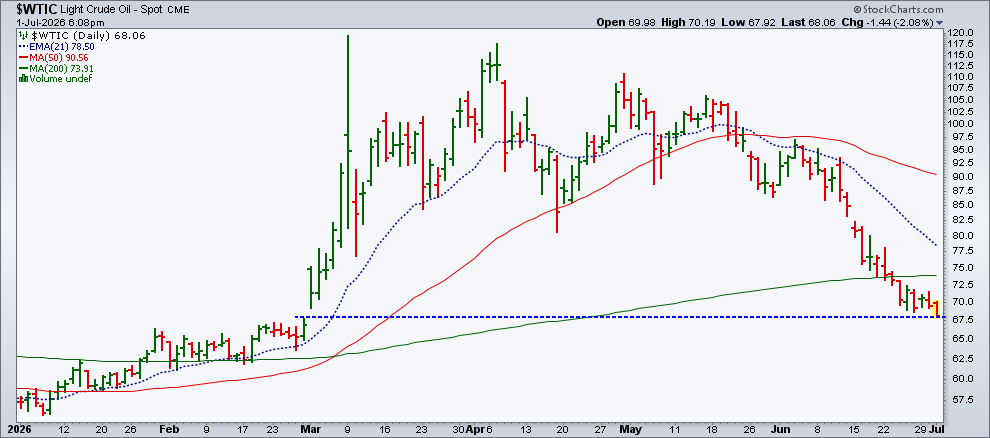
Light crude oil slipped below $70 per barrel and filled a gap from late February. Traders hope the U.S. and Iran will reach a peace deal.
The Japanese yen fell sharply against the dollar, dropping below its July 2024 low. A weak yen can trigger central‑bank intervention, as seen in mid‑2024.
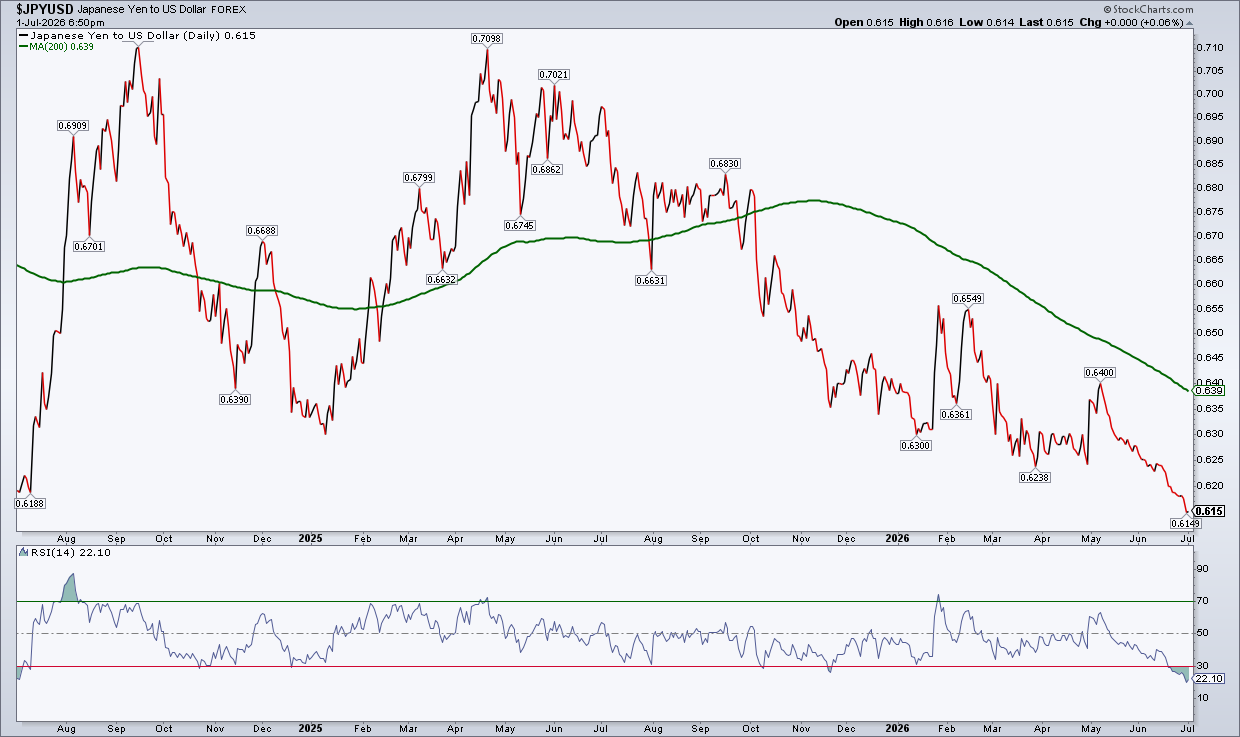
The dollar stays strong, helped by expectations that the Fed may raise rates as early as September.
Thursday will bring the June non‑farm payrolls report. A strong number could push the dollar higher and increase the odds of a rate hike, which would put more pressure on the yen.
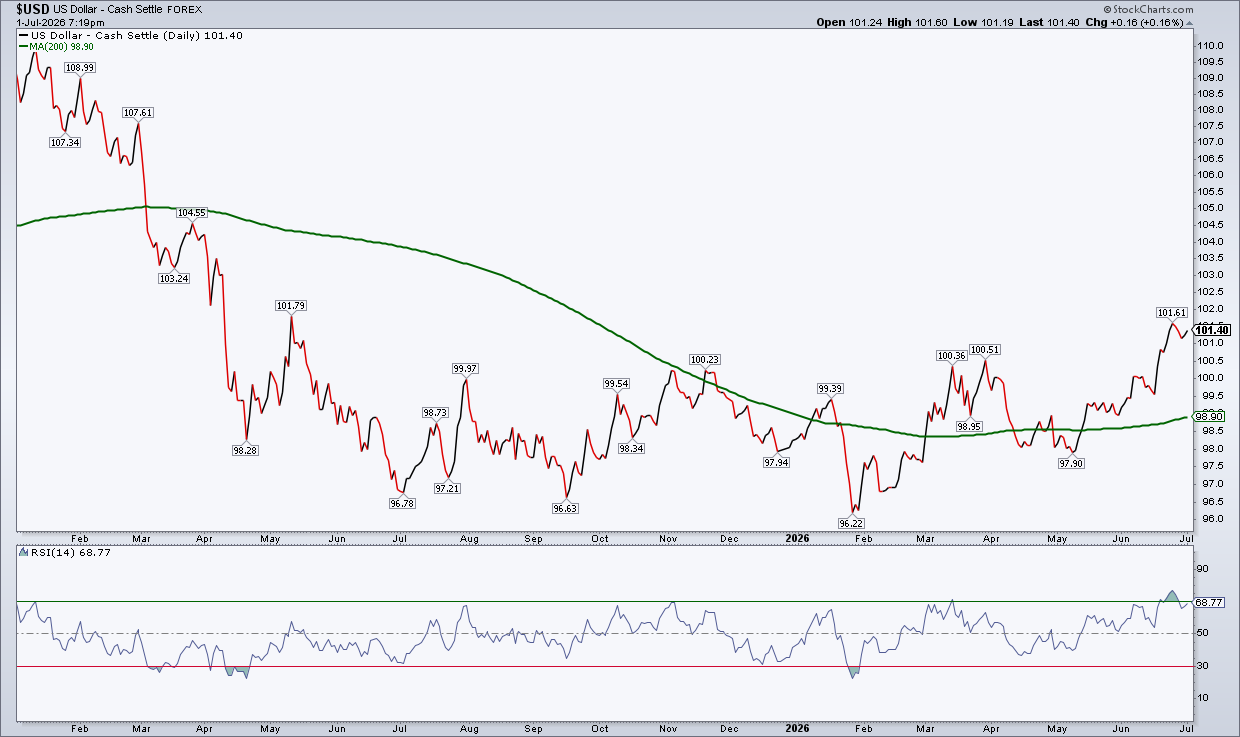
Right now the dollar is above its 200‑day moving average and the RSI is near 70, hinting at strong momentum but approaching overbought territory.
The Bottom Line
As the second half begins, watch the dollar‑yen pair, Middle‑East peace talks, and the Fed’s rate moves. The overall bias stays bullish unless the charts say otherwise. What do you think?
Disclaimer: This content is for education only and is not financial advice. Consult a professional before acting.
Source: Materials provided by https://articles.stockcharts.com.Note: Content may be edited for style and length.