

If you think the recent oil jump was caused only by the Iran conflict and the closing of the Strait of Hormuz, you might expect prices to fall back to where they were in late February.
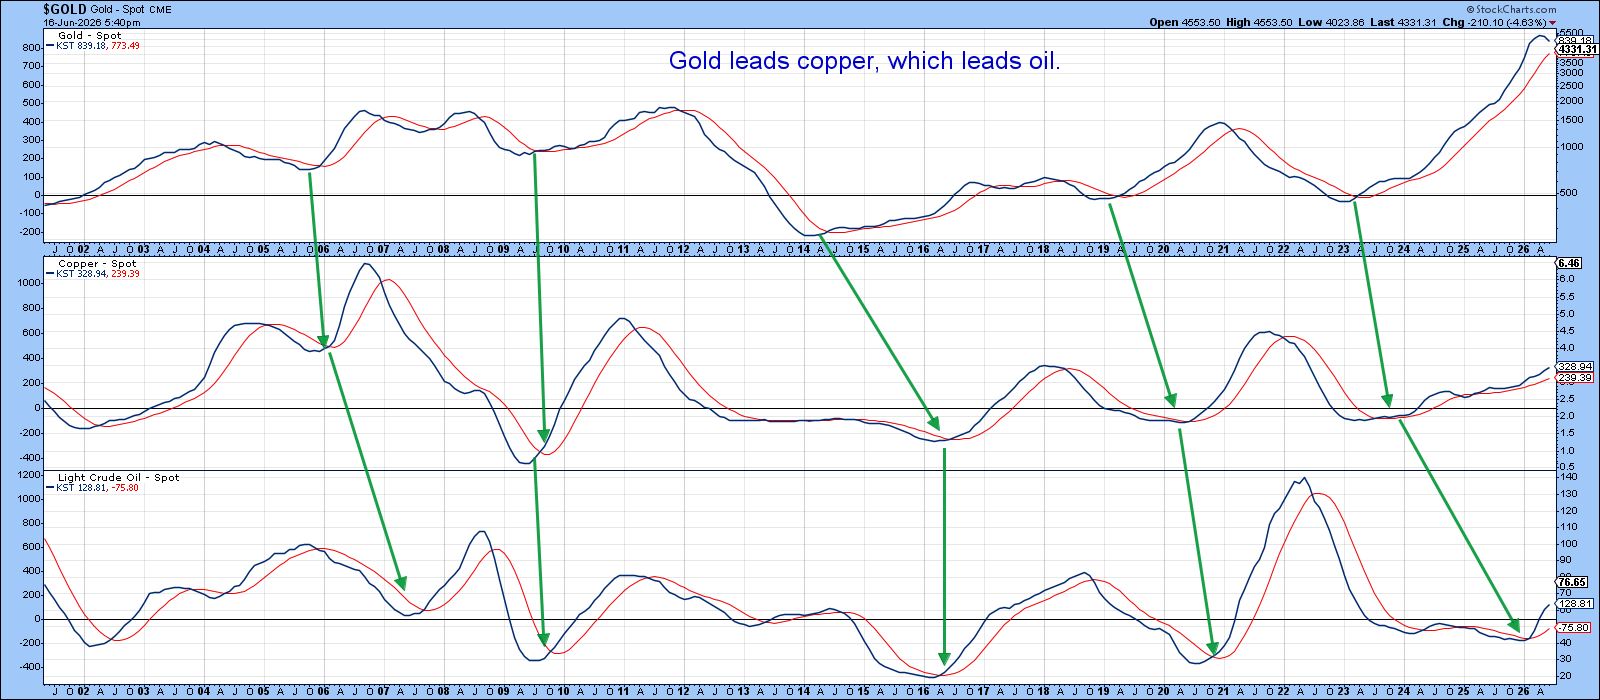
History shows a different pattern. Markets often move in a set order: gold first, then copper, then crude oil. This sequence appears in almost every business cycle.
Gold moves ahead because central banks ease policy and real interest rates drop. Investors then look for a safe store of value before growth really starts.
When the outlook turns more positive, copper follows. Copper reacts quickly to expectations of more manufacturing and building activity.
Oil is the last to move. It needs real economic activity – trucks, factories, and consumers – to rise before demand for oil climbs.
The chart below shows this classic order: gold momentum turns first, copper follows, and oil lags behind.
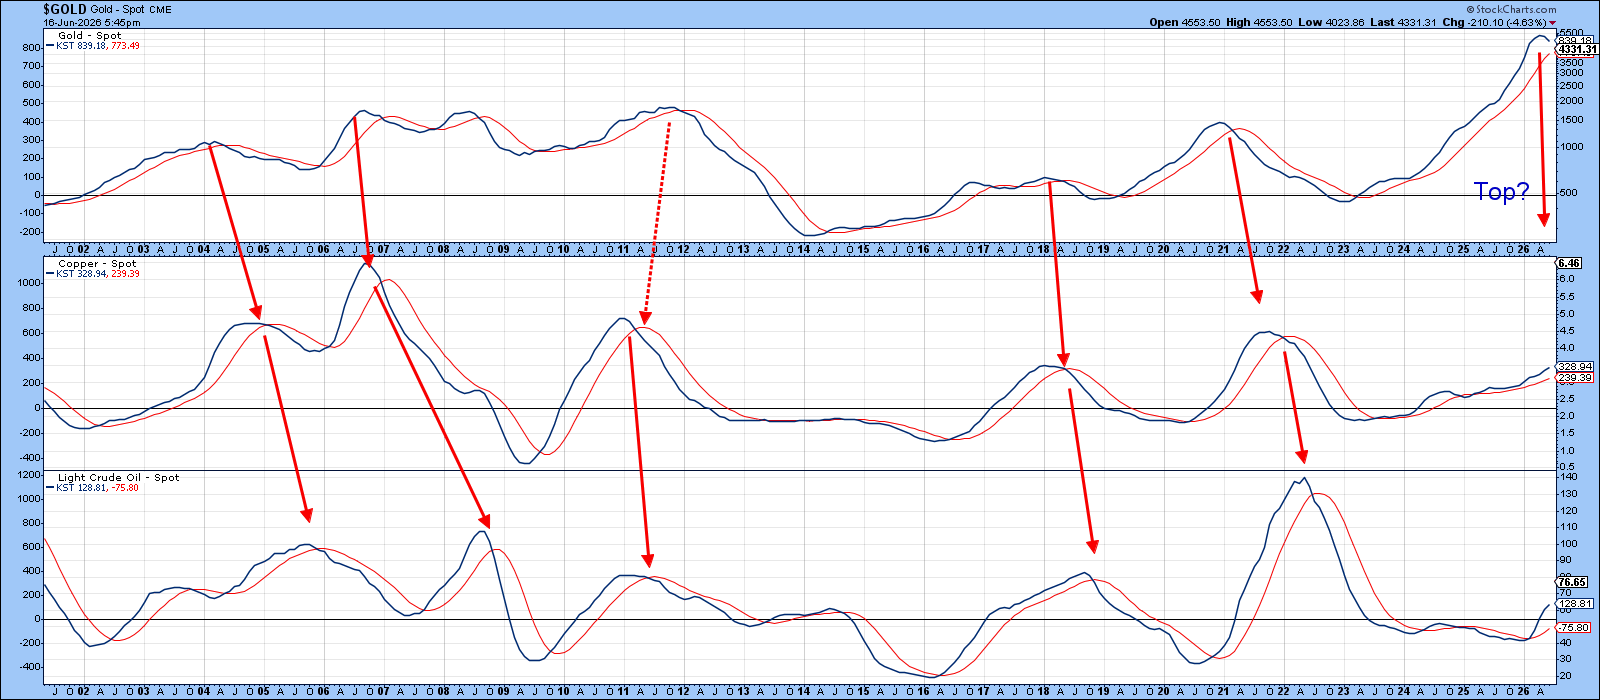
Looking at today’s charts, gold seems to be topping out, while copper is still climbing strongly. If the usual order stays the same, oil has room to rise before it peaks.
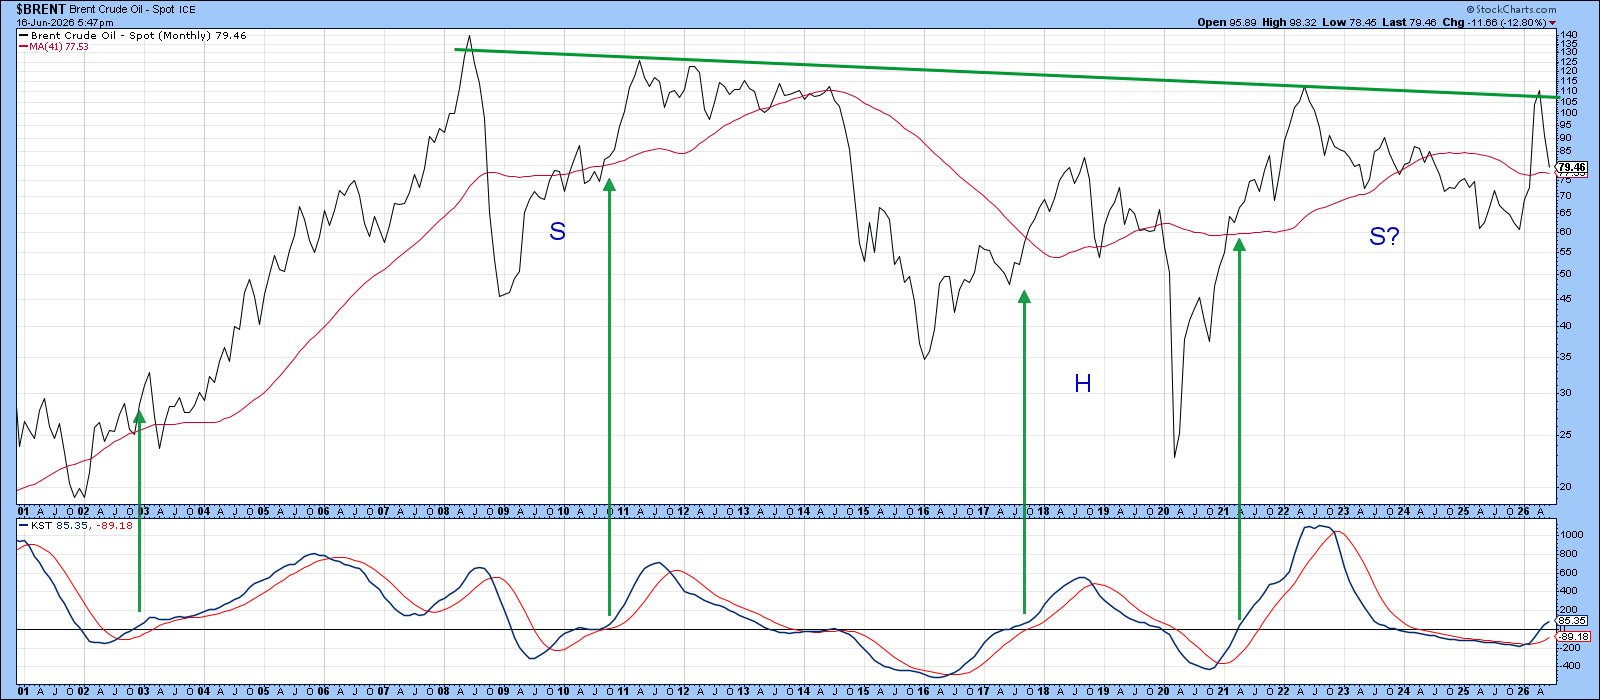
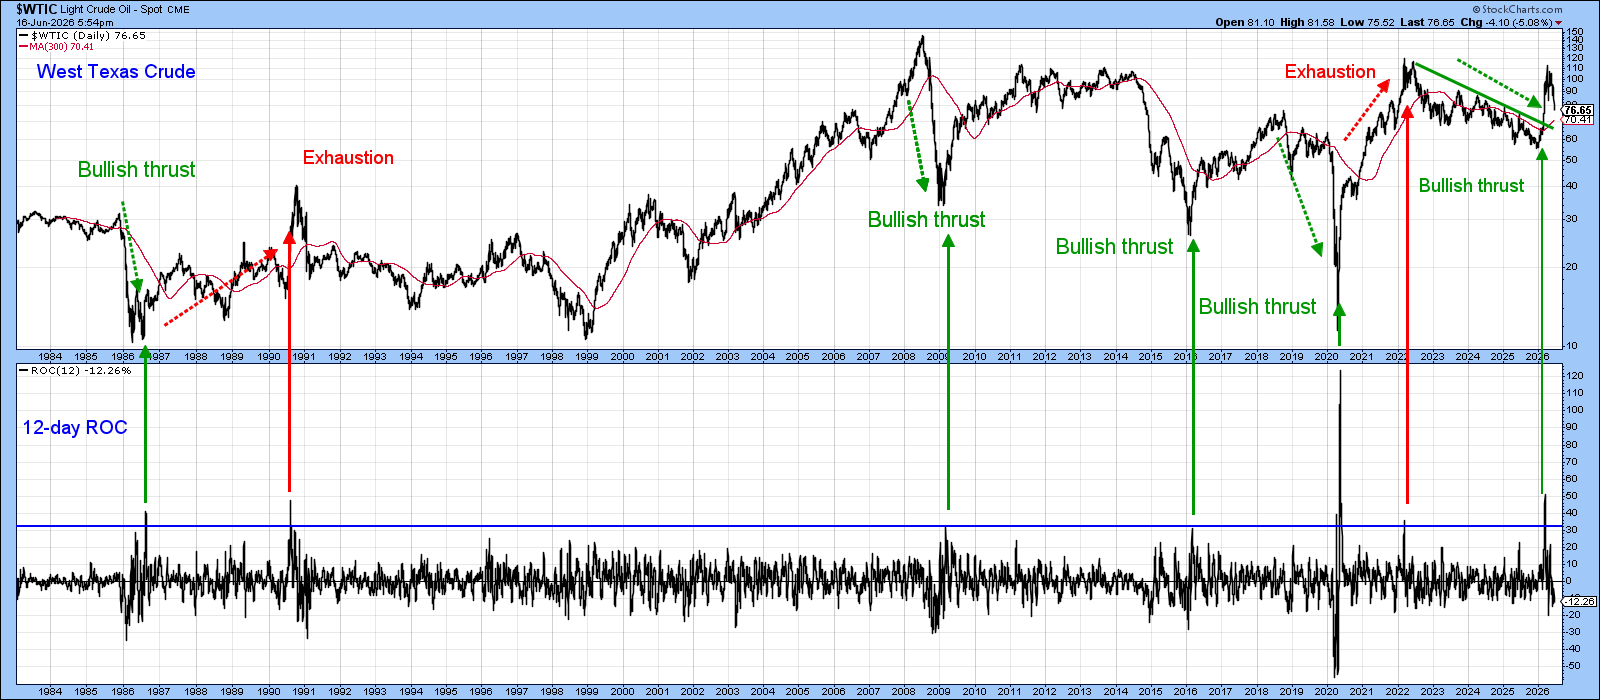
A longer‑term view shows a possible reverse head‑and‑shoulders pattern forming on oil prices. For this pattern to finish, oil would need to break clearly above the green neckline near recent highs.
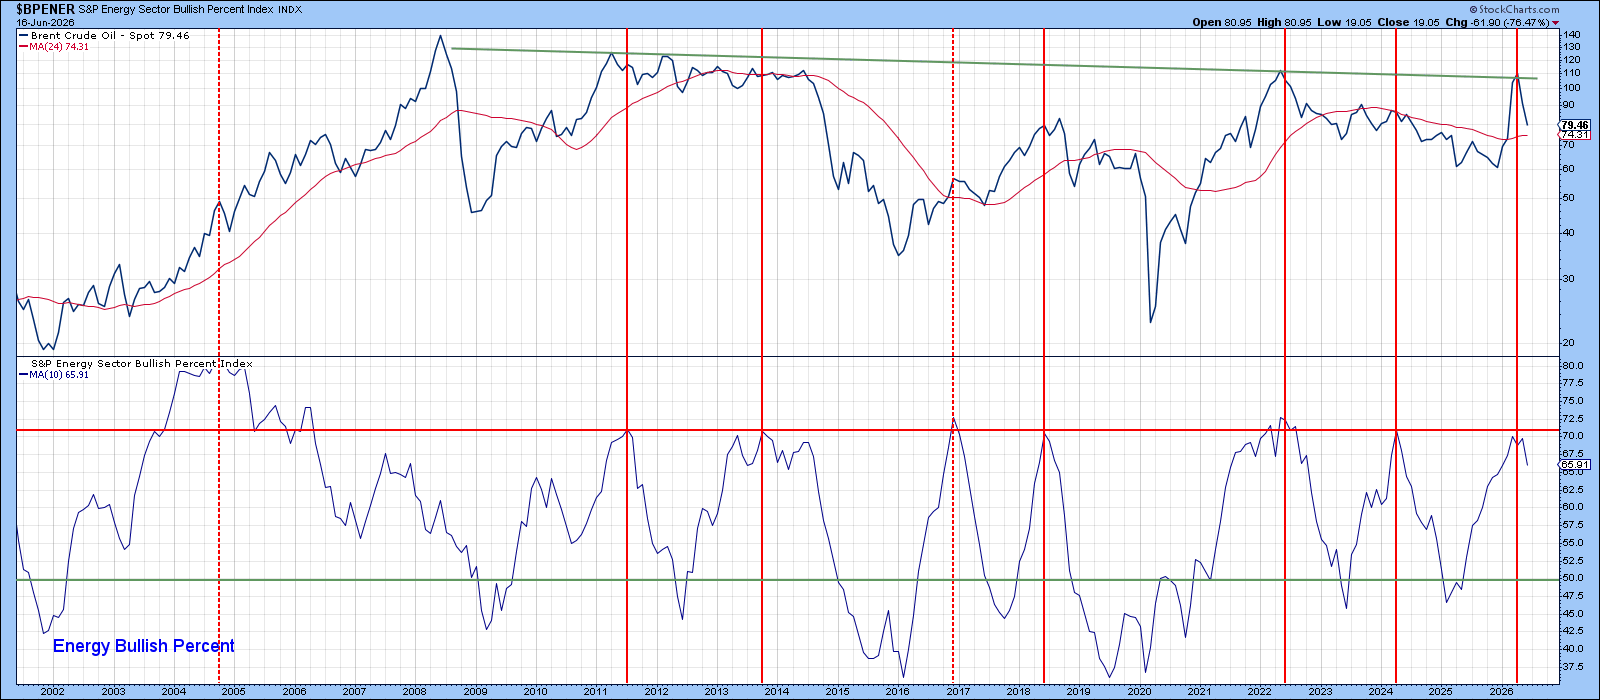
Short‑term pressure is also visible. The percentage of energy stocks in an uptrend is now at historically high, overbought levels. This can act as a headwind, but oil is still above its 24‑month moving average, a sign of a longer‑term uptrend.
The 12‑day Rate of Change (ROC) also gives clues. When the ROC spikes after a long rise, it can mean the move is ending. When it spikes after a long fall, it often signals a strong rebound.
In 2026 the ROC jumped up after a deep decline, suggesting the recent oil strength is just the start of a larger rally.
When we adjust oil prices for inflation using the Fed’s PCE index, the rally looks less dramatic. The price is still below the post‑2008 downtrend line, meaning long‑term resistance stays in place.
However, oil is now at a key crossing point where that downtrend meets a possible neckline for an inverse head‑and‑shoulders pattern. This makes the current level especially important.
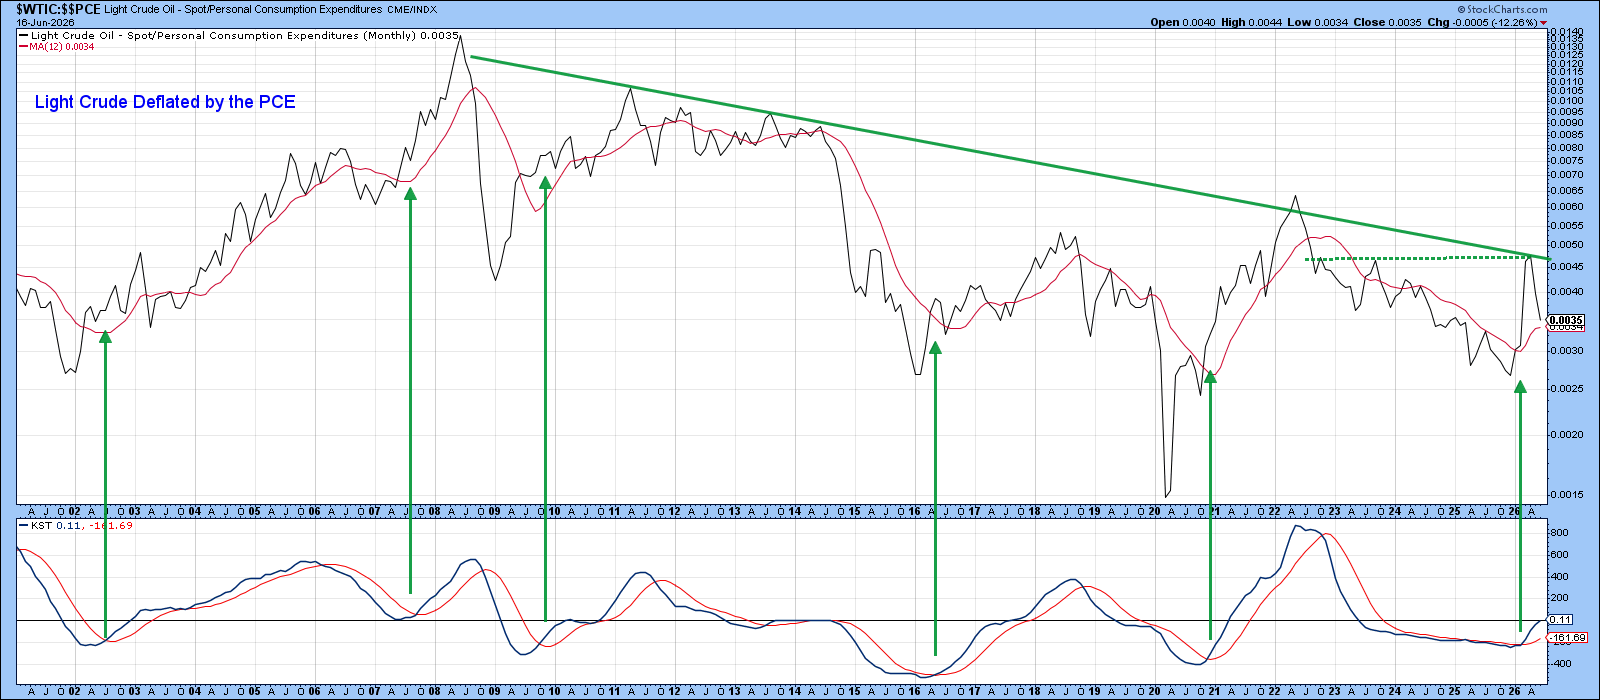
The KST indicator is still low, which means there is room for more upside momentum. Rather than making a firm forecast, the safest move is to watch if oil can break above the neckline and stay there. A strong breakout could signal a wider economic impact.
Source: Materials provided by https://articles.stockcharts.com.Note: Content may be edited for style and length.