
Investors watched Federal Reserve Chairman Kevin Warsh speak for the first time. The Fed kept rates steady, but Warsh sounded more hawkish than expected. That made the market think a rate hike could come sooner.
After the announcement, stocks fell and Treasury yields rose. By the end of the day, the three major indexes were all down.
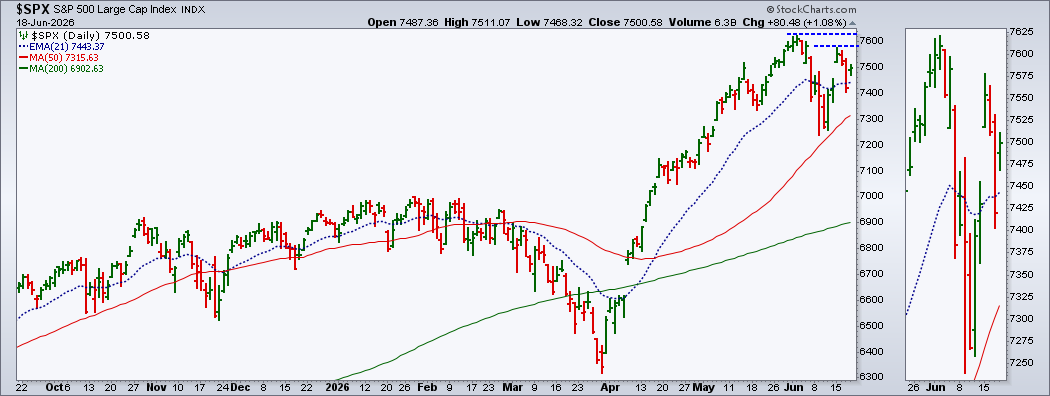
On Thursday, the market turned around. Both the S&P 500 and the Nasdaq climbed back above their 21‑day exponential moving averages (EMAs). These averages act like short‑term support lines.
S&P 500 Outlook
The S&P 500 is now trading above its 21‑day EMA. If it can push past 7,578 points, it may head back toward its recent high. A break below the EMA could send it toward the 50‑day simple moving average for the next test.
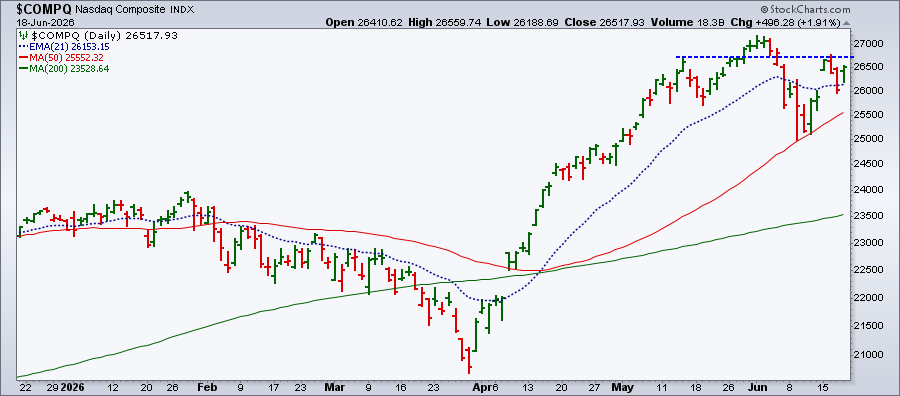
Nasdaq Outlook
The Nasdaq is in a similar spot. Breaking above 26,730 could let the index test its previous peak. If it falls back under the 21‑day EMA, the next support level is the 50‑day SMA.
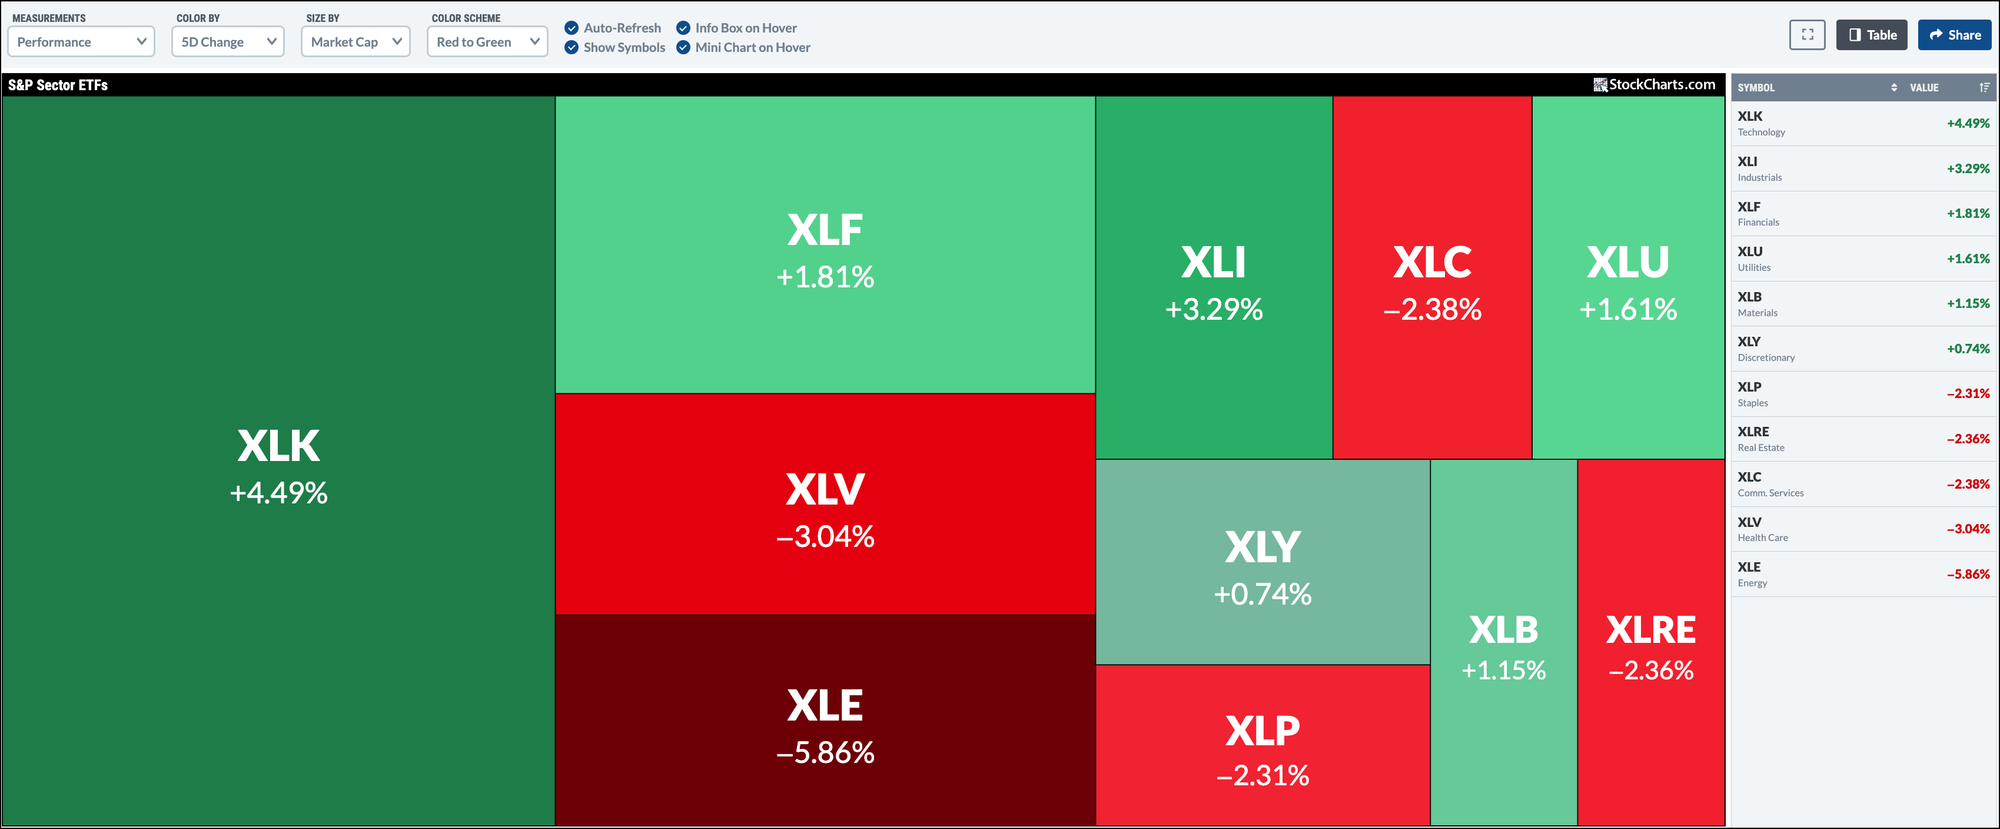
Technology Leads the Charge
Technology remains the strongest sector. Over the past five days, the tech sector ETF rose about 4.5%, outpacing all other groups.
Within tech, semiconductors are the biggest drivers. The VanEck Semiconductor ETF hit an all‑time high, highlighting the ongoing AI and chip boom.
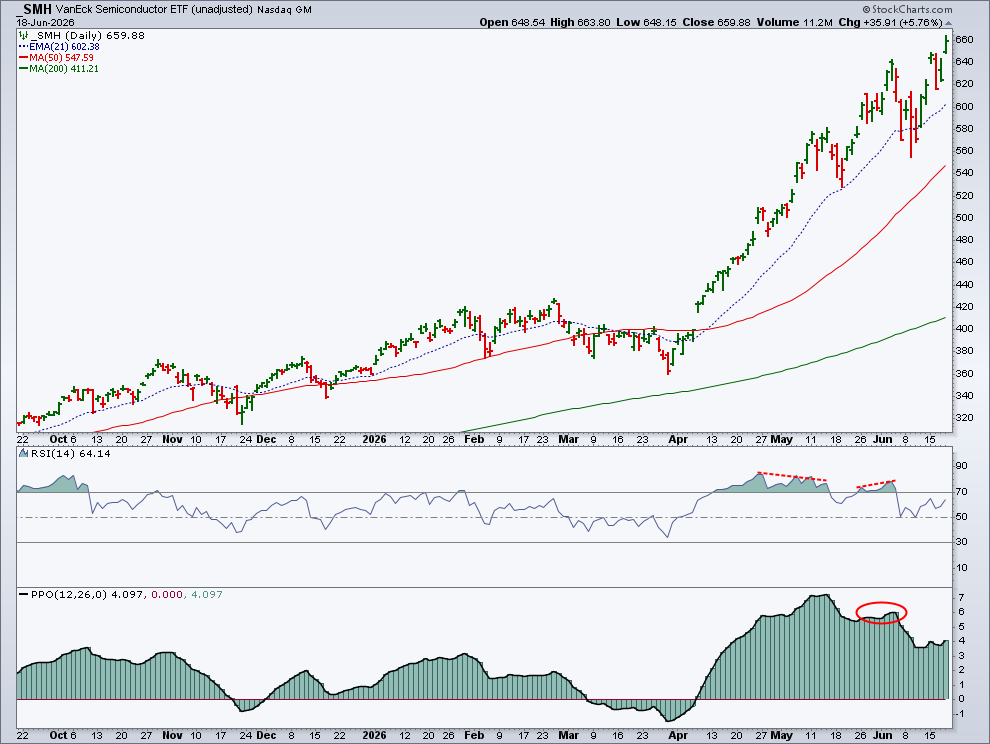
Technical indicators show modest momentum, but a stronger move could lift the whole sector higher.
Oil Prices Ease
Crude oil slipped after the United States and Iran signed a memorandum of understanding, allowing ships to move through the Strait of Hormuz again.
Light crude is finding support at its 200‑day moving average, while Brent fell below that line before bouncing back above it.
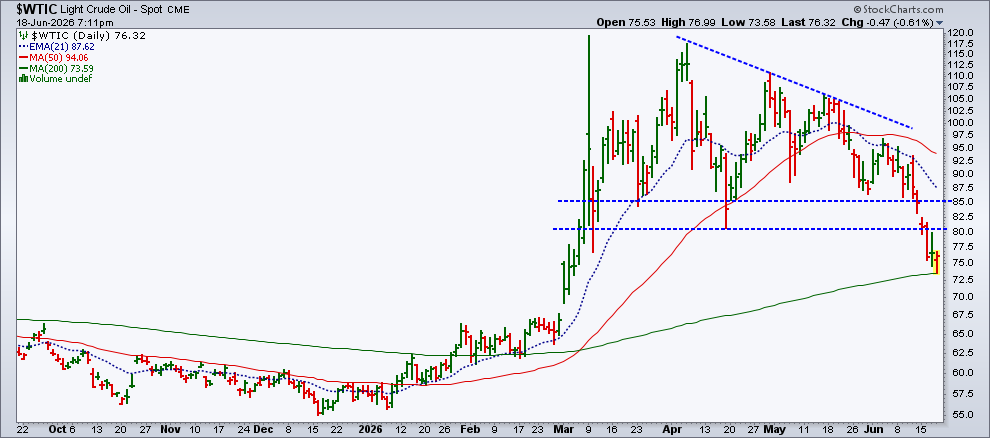
If oil keeps falling, inflation could ease, giving the Fed more reason to stay on hold.
U.S. Dollar Gains Strength
The dollar has been climbing since mid‑May and extended that move after the Fed meeting. It now sits above its March‑April highs.
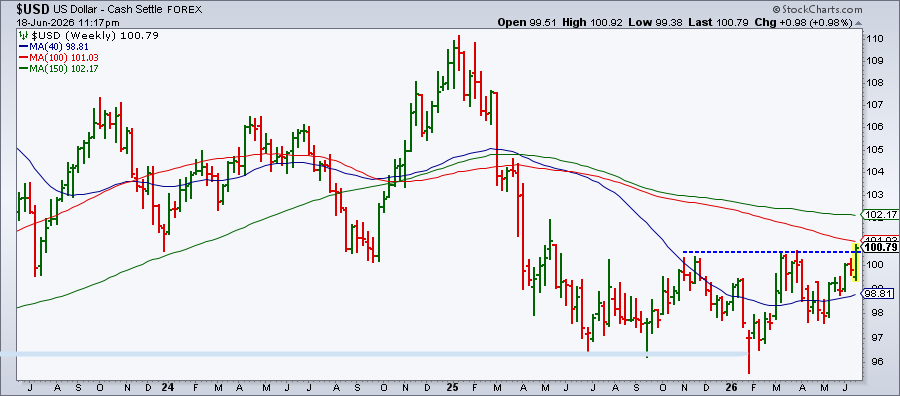
A stronger dollar puts pressure on precious metals.
Precious Metals Slip
Gold and silver are both below their 200‑day moving averages, and their short‑term EMAs are falling. Gold’s 21‑day EMA is now under the 200‑day line, signaling short‑term weakness.
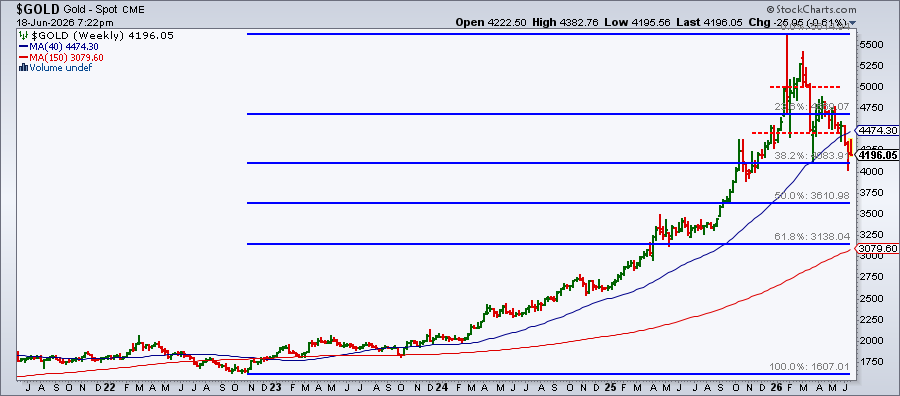
With lower chances of rate cuts, Treasury yields may stay firm, making bonds more attractive than gold.
Bottom Line
Overall, the equity market is still in an uptrend. Tech leads, oil steadies, the dollar climbs, and gold weakens. The next big data point will be the May Personal Consumption Expenditures report, the Fed’s favorite inflation gauge.
Investors should watch the charts for clear signals and let the price action guide their decisions.
Source: Materials provided by https://articles.stockcharts.com.Note: Content may be edited for style and length.