


The MAG7 ETF is a basket of seven big tech stocks. Right now it is doing a little worse than the overall market because three of its parts are weak. Four other stocks are strong, and the ETF is trying to break out again.
Leaders and Laggards Within MAGS
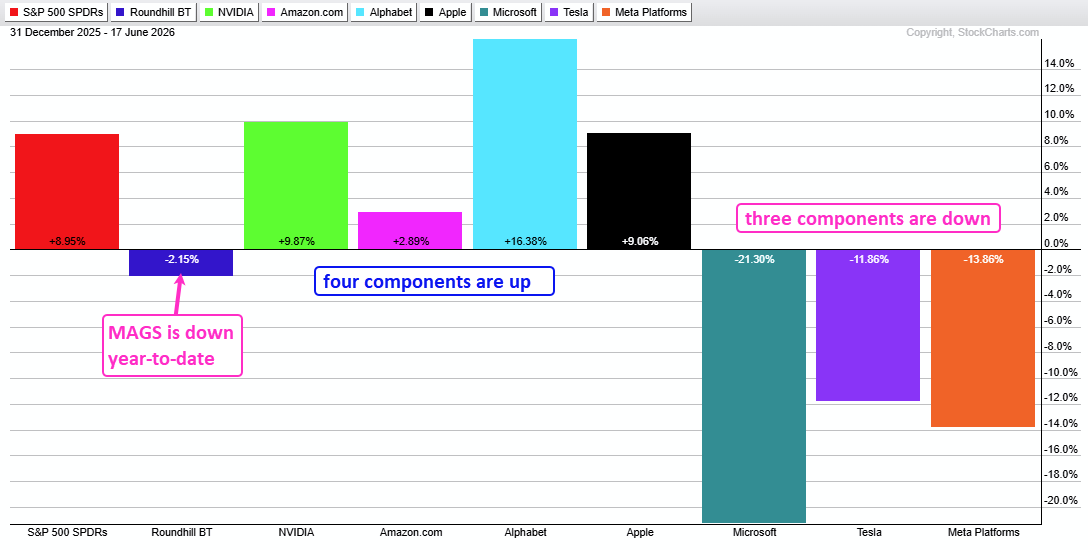
Four of the seven companies are going up. NVIDIA and Alphabet are the strongest. Microsoft, Tesla, and Meta have dropped a lot this year.
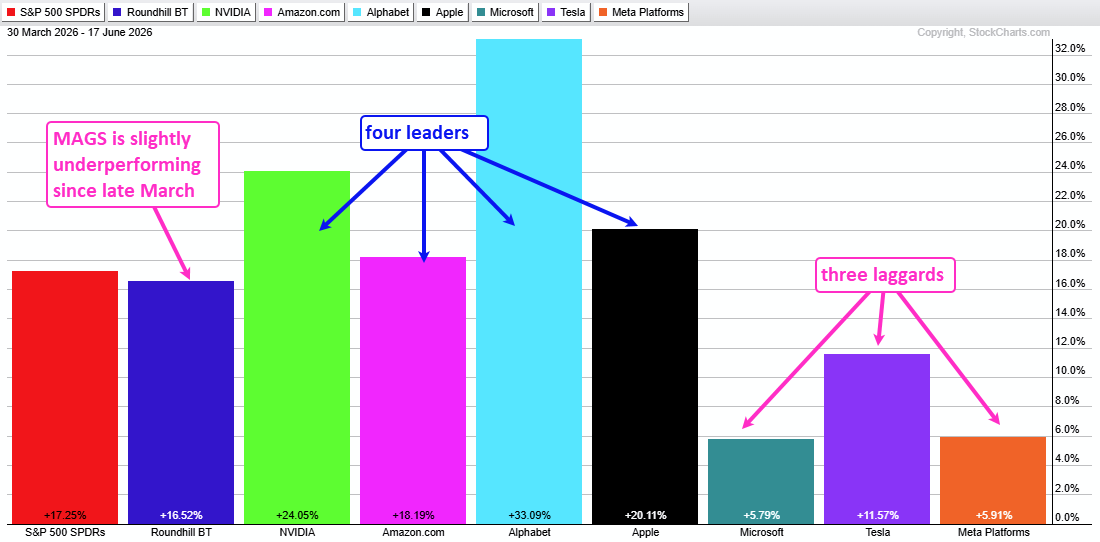
Since the low in late March, the ETF has risen about 16.5%, a little behind the market’s 17.3% gain. The winners are NVIDIA, Amazon, Alphabet, and Apple. The laggards remain Microsoft, Tesla, and Meta.
These charts show the seven stocks do not all move together. Because they behave differently, it is hard for the ETF to keep a steady trend.
MAGS Hits Moment of Truth
The ETF broke out in April and hit new highs in May. In early June it fell back toward its 200‑day moving average. That area is called the "moment of truth" – a place where a normal pullback should end.
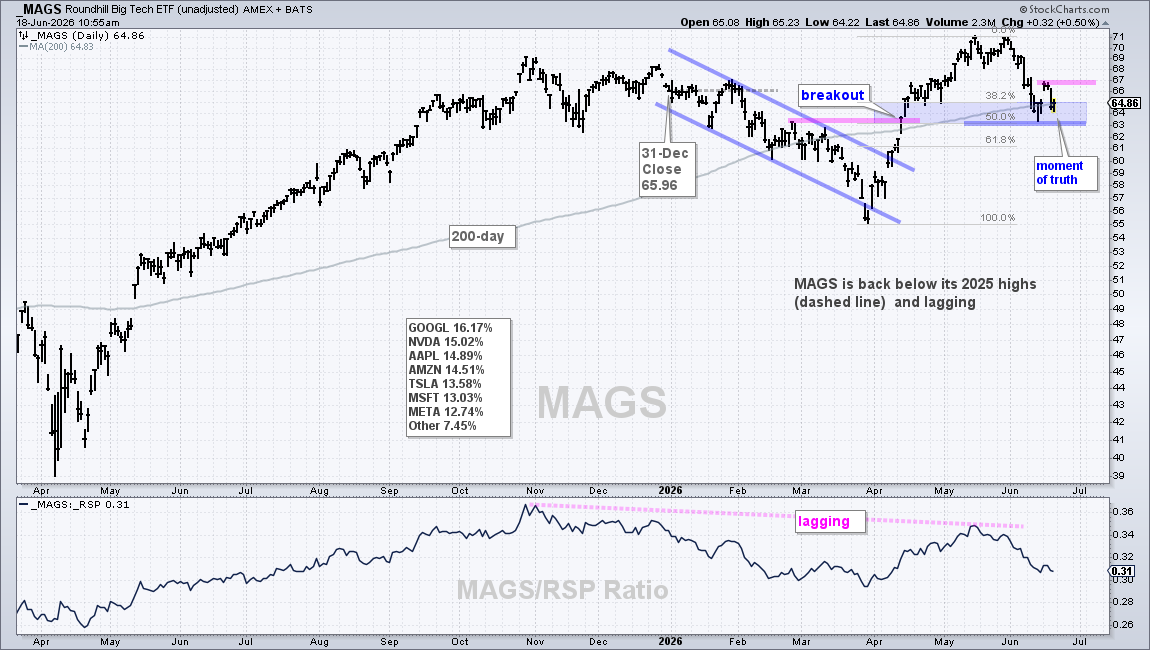
The price bounced up a little on Monday, then slipped back. That created a short‑term resistance level. If the price moves higher than 67, it may confirm a new upward move.
Apple Corrects after Breakout Surge
Apple’s chart shows a triangle pattern that formed from early December to April. The triangle broke out in early May, pushing the price higher. Now the stock is pulling back into the 265‑280 range, which lines up with its 200‑day average.
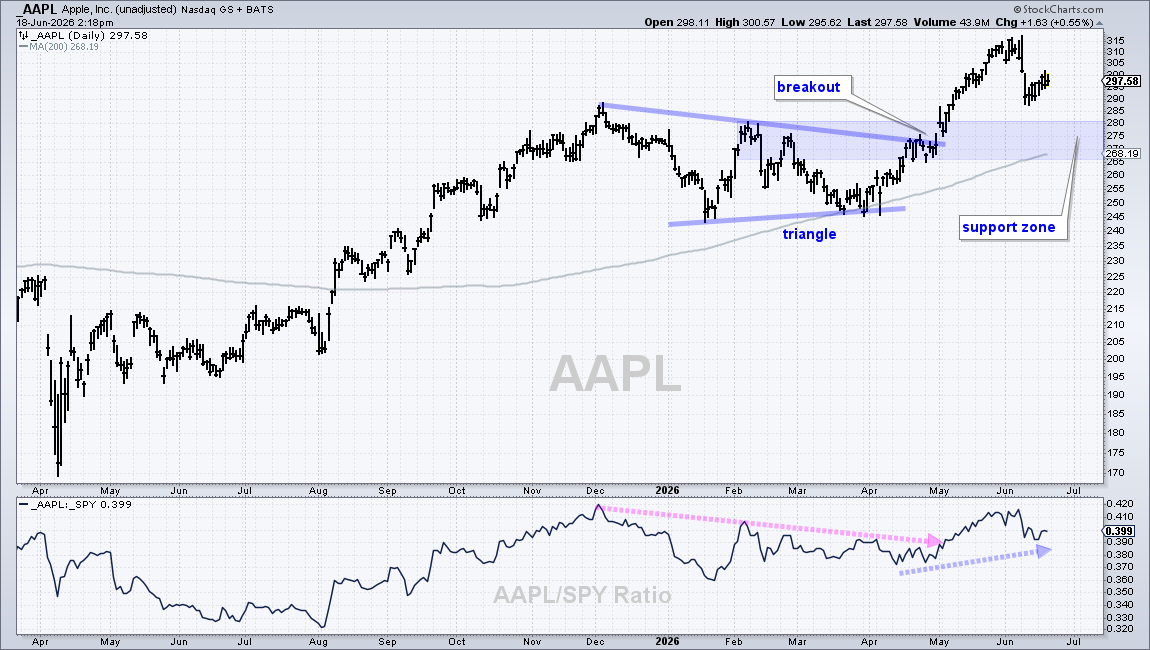
There is no clear new setup for Apple right now. The pullback could give a buying chance if the price stays in the support area.
Source: Materials provided by https://articles.stockcharts.com.Note: Content may be edited for style and length.