

SPY fell a little in early June, but the overall market is still moving up. More stocks are staying above their 200‑day moving averages, which is a good sign. Small‑cap stocks are especially strong right now.
Breadth Improves While SPY Pulls Back
SPY dropped about 4.5% from its recent high, yet the long‑term line stays upward. When most stocks are in an uptrend, a short pullback can be a buying chance.
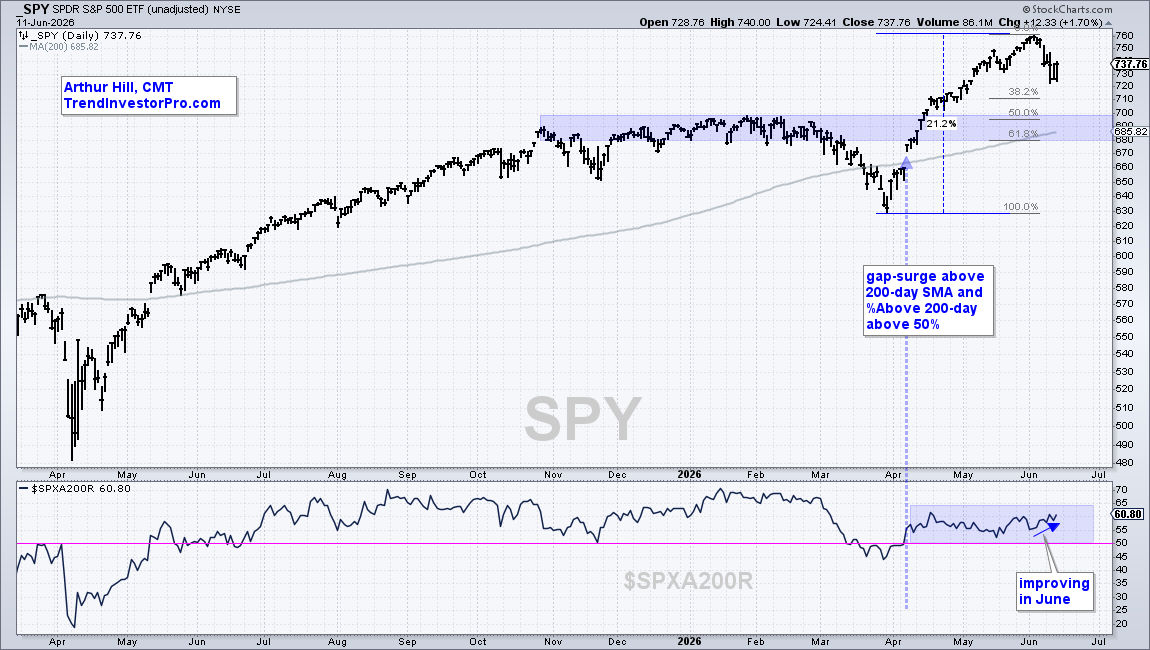
The chart shows SPY breaking above its 200‑day average on April 8. Since then, more than half of the S&P 500 stocks have stayed above that level. The index rose 21% in the spring, hitting new highs each month.
If the pullback continues, watch the 680‑700 range. That area lines up with the 200‑day average and key retracement levels, which often act as support during corrections.
Small‑Cap Stocks Keep Leading
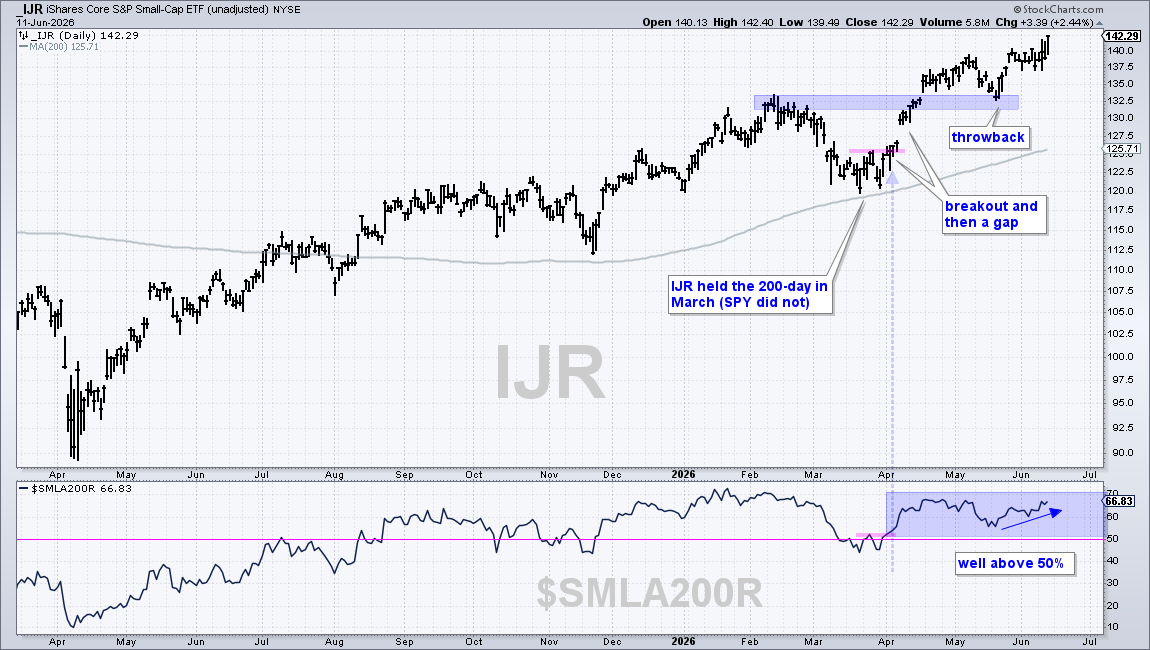
The S&P SmallCap 600 ETF (IJR) is also above its 200‑day average and has made fresh highs this week, even as SPY slipped. Over 65% of small‑cap stocks are in long‑term uptrends, outpacing the large‑cap side.
Industrial ETF Shows Bullish Consolidation
The Industrials SPDR (XLI) is still in a strong uptrend. It broke out with a gap in early April and is now holding just below a new high. The price is forming a small triangle, which many traders see as a pause before the next move up.
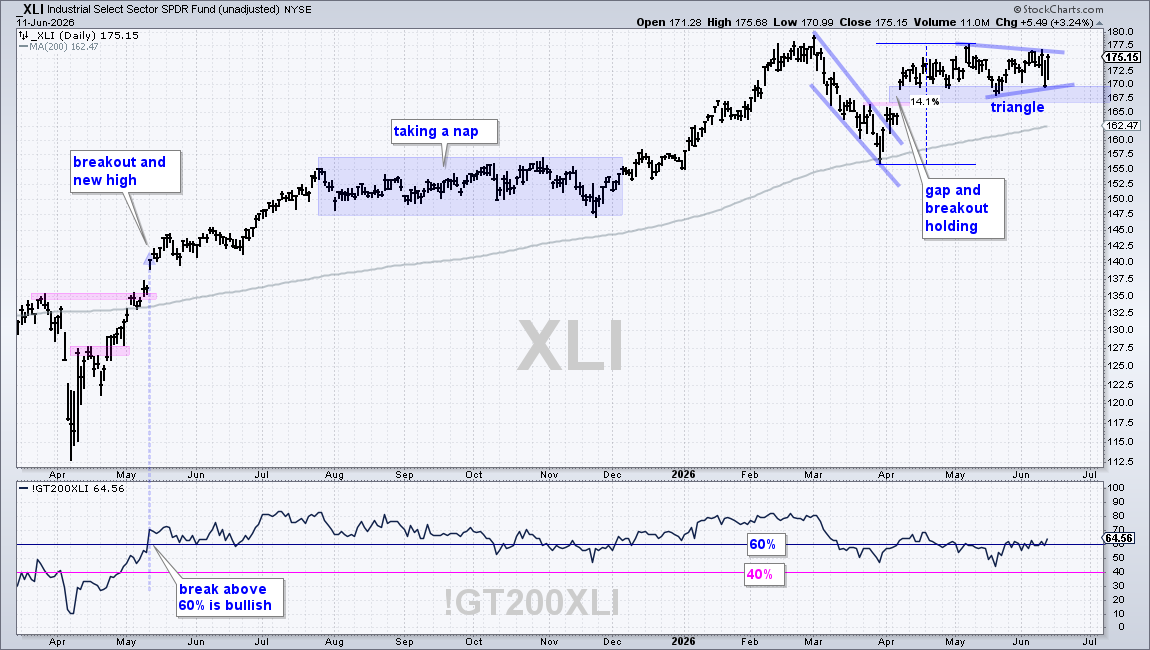
About 65% of the industrial stocks in the ETF are above their 200‑day EMAs, confirming the bullish bias. A clear break above 177.5 could push the ETF to new highs, while a close below 167 might signal a short‑term pullback.
Source: Materials provided by https://articles.stockcharts.com.Note: Content may be edited for style and length.